

1. Introduction
MCC is required by statute to conduct cost benefit analysis (CBA) and to calculate the economic rate of return (ERR) for projects supported through country compacts. ERR estimates form a critical part of the project approval process and are required to equal or exceed a threshold level of ten percent. To clarify methodology and to improve the consistency across country compacts, the Economic Analysis division, which is responsible for conducting CBAs, is developing a series of guidance documents describing CBA methods and approaches for the major investment sectors in which MCC typically invests. This current report covers non-WASH health projects and projects for which health effects are the primary intended outcomes in the project logic (please see the WASH Sector CBA Guidance for WASH projects with health effects)1 This is a living document that will be updated periodically as necessary.
Health is a central component of human capital. Healthier individuals can learn more in school and be more productive at work, and tend to earn more lifetime income. Further, because of their increased longevity, healthier individuals have greater incentive to accumulate human capital. There is substantial literature documenting the two-way cause-and-effect relationship between health and income. Higher income individuals can have better health outcomes through a variety of ways, including but not limited to improved nutrition, access to medical care, and better housing and working conditions. This relationship between health and income also exists at the country level. Healthier countries typically have a more productive labor force, and higher income countries can improve population health by providing more robust public health infrastructure.
This guidance provides standard methodologies for CBA of non-WASH MCC health sector interventions, and other MCC interventions whose primary benefits are improvements in health outcomes—that is, improvements in mortality or morbidity.2 Further guidance is provided here for estimating benefits for projects that are not health sector interventions but can significantly affect mortality and morbidity, such as climate change mitigation interventions that result in reductions in household air pollution (e.g. MCC’s Mongolia I Energy and Environment project) and/or improved ambient air quality (e.g. Kosovo’s Battery Energy Storage Systems Project).
Section two provides a taxonomy of health interventions previously implemented by MCC for economists who are new to the sector. This taxonomy may be expanded as MCC adds new intervention types to its portfolio. Section three provides general guidance for valuing changes in mortality and morbidity that are forecast to result from an MCC intervention. Section four recommends tools and methods to forecast the change in mortality and morbidity likely to result from an MCC intervention. The list in section four may also be expanded over time as additional tools and methods become available. Section five provides guidance for analyzing the distribution of benefits between different stakeholder types.
2. Taxonomy of Health Interventions
This section provides a taxonomy of health interventions previously implemented by MCC, which is intended to help economists who are new to the health sector to understand the basic structure and economic rationale of health sector interventions, and begin to think through approaches to structure health intervention CBAs. This taxonomy will be expanded as MCC adds new health intervention types to its portfolio.
A high-level summary of the taxonomy is presented in Table 1. The health interventions types include health systems strengthening, social and behavior change related to behaviors that effect health outcomes (e.g. smoking, seat belts), maternal & child health, nutrition specific and sensitive interventions, air pollution reduction, and countering gender-based violence. Activities in other sectors, such as WASH, agriculture, education, energy, and transport, can also produce large health benefits. Health benefits in other sectors are explored in sector specific CBA guidance documents – these guidelines will cover only the non-health sector topics not covered in other guidance, such as nutrition and air quality.
As of this writing, MCC has intervened in the areas of maternal and child health and nutrition (MCHN) in Indonesia, primary health care in Lesotho, and non-communicable disease and injury (NCDI) in Mongolia. MCC has also signed a second compact with Lesotho that includes a Health Systems Strengthening (HSS) project, and has signed a compact with Kosovo that includes an energy storage system expected to improve ambient air quality. In addition, MCC has implemented a number of health related interventions as part of its smaller Threshold Programs, although cost benefit analysis is not required for these.
A discussion on each of the health intervention types presented in Table 1 follows in separate sub-sections, presenting a brief overview of the nature of the interventions, their general program logic, and MCC’s experience in funding such interventions.
| Project Type | Sector(s) | Example Interventions |
|---|---|---|
| 1. Health systems strengthening3 | Public financial management, clinical care, infrastructure, digital information, climate change, nutrition |
|
| 2. Social and behavior change (SBC) targeting diseases (COVID-19, diabetes) or conditions (over-nutrition, mental health) or behaviors (regular exercise, wearing seat belts, smoking, air pollution protection behaviors) | Infectious and non-communicable diseases, nutrition, mental health, inclusion, climate change |
|
| 3. Maternal and Child Health (MCH) | Clinical care, public financial management, infrastructure, digital information, climate change, nutrition, agriculture |
|
| 4. Air pollution reduction | Energy, transport |
|
| 5. Nutrition | Nutrition, Clinical Care, Agriculture, Education |
|
| 6. Gender-based Violence and Workplace Harassment Prevention and Treatment | Health, gender and social inclusion |
|
Note: The taxonomy of health projects presented in this table is not comprehensive. There is a sector specific CBA guidance for WASH related interventions, which discusses health benefits from WASH projects.
2.1 Health Systems Strengthening
While many global health interventions consist of “vertical projects” that target a single health outcome, many international donors also focus on “horizontal approaches” that aim to strengthen the health system, as a whole (Morton et al. 2016).3 The World Health Organization (WHO) outlines six building blocks of health systems, which are summarized in Table 2.
| Health System Building Block | WHO Definition (WHO 2007) |
|---|---|
| Service delivery | “Good health services are those that deliver effective, safe, quality personal and non-personal health interventions to those who need them, when and where needed, with minimum waste of resources.” |
| Health workforce | “A well-performing health workforce is one that works in ways that are responsive, fair and efficient to achieve the best health outcomes possible, given available resources and circumstances...There are sufficient numbers and mix of staff, fairly distributed; they are competent, responsive and productive.” |
| Information | “A well-functioning health information system is one that ensures the production, analysis, dissemination and use of reliable and timely information on health determinants, health systems performance and health status.” |
| Medical products, vaccines, technologies | “A well-functioning health system ensures equitable access to essential medical products, vaccines and technologies of assured quality, safety, efficacy and cost-effectiveness, and their scientifically sound and cost-effective use.” |
| Financing | “A good health financing system raises adequate funds for health, in ways that ensure people can use needed services, and are protected from financial catastrophe or impoverishment associated with having to pay for them.” |
| Leadership/governance | “Leadership and governance involves ensuring strategic policy frameworks exist and are combined with effective oversight, coalition building, the provision of appropriate regulations and incentives, attention to system-design, and accountability.” |
Much of the health system literature highlights the importance of health platforms, which use similar inputs and logistics but address different health problems (Chang et al. 2017). Using this platform perspective, health systems strengthening (HSS) activities are “investments in specific inputs and infrastructures such as supply chains, clinical laboratories, physical laboratories, diagnostic equipment, medical staff, and data capture systems” (Hauck et al. 2019). What separates investments in health systems or health platforms from other types of health interventions is the mutual dependency of different components of the system.4 An investment in a single component of health platform should thus produce benefits across multiple interventions that rely on the platform. The literature separates health systems strengthening activities into three categories (Hauck et al. 2019, Cleary 2020) as summarized in Table 3.
| Type of HSS Improvement | Definition | Examples |
|---|---|---|
| HSS1: Investments in platform efficiency | Changing existing services that improve the technical efficiency of the system. | New information systems, workforce training, improved laboratory facilities, improved quality of care |
| HSS2: Investments in platform capacity | Relaxing capacity constraints that limit the ability of the system to produce the optimal range and quantity of outputs. | New physical infrastructure, new equipment, new human resources |
| HSS3: Investments in new platforms | Investing in a new type of platform. | New mobile services, new supply chain systems |
For each of these types of improvements, the project logic would assume that the health systems strengthening enhances the cost-effectiveness, efficiency, capacity, and/or quality of health care delivery, which in turn improves health outcomes. Since health systems strengthening activities rarely target specific diseases, projects in this area are typically assumed to decrease all-cause mortality and morbidity or decrease the most common causes of mortality and morbidity in a given country (see, for example, Barasa et al. 2012, Kingkaew et al. 2016).
There are limited examples of MCC HSS activities. In the Mongolia I Compact, MCC adopted a hybrid HSS and health communication, promotion, and education project. The HSS component of the project provided research, equipment, and training for early detection of non-communicable disease and injury (NCDIs) (HSS1 and HSS2). In the Lesotho I Compact, MCC renovated key medical infrastructure and provided updated equipment (HSS2). MCC’s Lesotho II Compact aims to improve all three categories of HSS activities. In particular, the intervention aims to improve platform efficiency (HSS1) by enhancing the patient record system, updating standards of care and establishing referral guidelines, to improve platform capacity (HSS2) by providing new equipment, and to invest in new platforms (HSS3) specifically in the area of digital health systems.
2.2 Health Social and Behavior Change (SBC)
Health SBC interventions are different from HSS interventions in that they target behavior change related to a specific disease, condition or behavior. The project logic for such interventions would assume some level of coherence with the intervention, which would then translate into improved health outcomes. For example, in the case of an insecticide-treated bednet (ITN) SBC campaign, the project output would be that some percentage of targeted population used ITNs that would otherwise not have used the ITNs absent the intervention. The short-term project outcome would thus be reduced morbidity and mortality from malaria while the long-term project outcome would be increased productivity.4
MCC health projects have historically focused more in the HSS domain as detailed in Section 2.1 above. However, a sub-activity of the Community-Based Health and Nutrition to Reduce Stunting Project in the Indonesia I Compact included a mass media campaign and training at the community level to increase awareness of stunting and foster behavior change related to health, nutrition, and sanitation.
2.3 Maternal and Child Health (MCH)
Some of the most common MCH interventions include prenatal care, postnatal care, immunizations and family planning services. Other interventions may include health focused education programs for mothers and families, home visits by health professionals, and community-based programs that provide support for parents and children. These interventions are designed to improve the health of mothers and children by providing them access to quality healthcare services and support.
The Indonesia I Compact Community Based Health & Nutrition Project was both a MCH and Nutrition project. Indonesia provides government subsidized health care to the population. MCC’s investment intended to strengthen the Government of Indonesia’s ability to provide maternal and child services, among other things.
Although not a health intervention, it is worth noting that there is also a strong empirical correlation between general parental education, particularly maternal education, and child health (Thomas et al. 1991; Le and Nguyen 2020). Empirical investigations have tried to determine whether maternal education simply serves as a proxy for socioeconomic status and has no direct causal relationship on child health (Desai and Alva 1998), or if evidence can be found of a more direct causal relationship. Using variation in exposure to a compulsory education program in Turkey, Güneş (2015) shows mother’s education improves infant health even after controlling for multiple confounding factors. Similarly, exploiting a natural experiment of increased secondary school access in Zimbabwe, Grépin and Bharadwaj (2015) find reduced infant mortality rates among women who participated in the program. Makate and Makate (2016) find similar desirable effects of improved maternal education on infant mortality in Malawi, using variation in primary school expansion to identify the causal impacts. A systematic review of maternal education and child health finds that even after controlling for potential endogeneity, there remains a significant relationship in the literature between maternal education and child health (Mensch et al. 2019). While a separate sector CBA guidance is available for valuing the benefits of education interventions, we note here that child health may be an important co-benefit stream to consider for education intervention CBAs.
2.4 Air Pollution Reduction
Air pollution is a major contributor to human disease, with estimates suggesting that air pollution was responsible for 6.4 million deaths in 2015 (Landrigan 2017). Given MCC’s work in sectors affecting air pollution, including but not limited to energy and transport, CBA analysts for interventions that are expected to significantly affect air pollution should consider incorporating health effects.
Household air pollution (HAP), from solid fuel combustion, contributed to approximately one-third of the air pollution-related deaths in 2015 (Landrigan 2017). Approximately, 24 billion people cook using open fires or inefficient stoves (WHO 2022). Since, women and children are more likely to engage in domestic activities such as cooking, they are disproportionately impacted by household air pollution (Martin et al. 2013). Specifically, HAP exposure results in premature deaths from acute lower respiratory infections, chronic pulmonary disease, and lung cancer (WHO 2009). Further, prenatal exposure to HAP increases the risk of stillbirth, low birth weight, and delays in cognitive development (Pope 2010; Dix Cooper 2012).
To date, there have been two projects at MCC that have explicitly targeted household air pollution. MCC’s Mongolia I Energy and Environment Project included a stove subsidy component that incentivized households to use energy efficient stoves. The cost-benefit analysis for this activity modeled health benefits from the use of energy efficient stoves using a cost of illness and DALYs-averted approach. The Tanzania Energy Sector Project provided new and upgraded network capacity to new and existing customers. The project logic included a substitution away from household diesel and kerosene use which would, in turn, improve health outcomes. The ERR for this project used a WTP for improved energy access, and thus did not explicitly model health outcomes to avoid double counting.
The remaining two-thirds of air pollution deaths in 2015 cited in Landrigan were attributed to ambient air pollution. Similar to household air pollution, ambient air pollution causes miscarriage, premature births, low birth weight, cognitive delays, and is a contributor to diseases that account for almost 1 in 10 of all deaths for children (UNICEF 2016; Malley et al. 2017). Ambient air pollution results in a loss of productive labor by increasing illness and premature death and decreasing quality of life. As a result, global ambient air pollution was estimated to result in $144 billion labor income losses in 2013 (World Bank and IHME 2016). Urbanization trends are worsening ambient air pollution, and without action to control urban air pollution, the OECD projects that air pollution deaths will at least double by 2060, with children and elderly populations being the most vulnerable (OECD 2016).
While MCC projects to-date have not modeled health benefits from air pollution reduction, given urbanization trends, economists should consider incorporating such benefits into CBAs for relevant projects in the future. For example, the Battery Energy Storage Systems Project, which is under development in the Kosovo Compact, aims to transition Kosovo into a cleaner energy future, by supporting battery storage systems and investing in renewable energy projects. The cost-benefit analysis, which is under development for this compact, is considering the health benefits from the air pollution reductions that will result from this project.
2.5 Nutrition
Nutrition projects can have health-related and non-health related benefits. A nutrition toolkit for CBA is under development at MCC, which will provide further details on how to value the benefits of nutrition-related investments. Until the toolkit becomes available the economist should use the standard approach described in these guidelines for health-related benefits of nutrition projects.
Global nutrition progress is threatened by the increasing severity and frequency of crises, including conflict, climate shocks, and the COVID-19 pandemic. These crises can result in under-nutrition or over-nutrition. Between 2019 and 2020, the prevalence of undernourishment rose from 8 to 9.3 percent and about 150 million more people became affected by hunger (FAO et al. 2022). Increasing commitments and investment in maternal and child nutrition is vital to prevent further backsliding (Global Nutrition Report 2022).
Nutrition interventions are often categorized as nutrition-specific or nutrition-sensitive, both of which MCC may invest in. Nutrition-specific interventions are those that address the immediate determinants of nutrition, such as inadequate food and nutrient intake and caregiving practices. Nutrition-sensitive interventions are those that address the underlying determinants of nutrition, such as food security and access to health services (Ruel et al. 2013).
MCC investments in the Community Based Health and Nutrition Project under the Indonesia I Compact included nutrition related interventions. The nutrition components of the project were designed to reduce and prevent low birth weight, childhood stunting, and malnourishment of children and to increase household income through cost savings, productivity growth, and higher lifetime earnings.
The project logic should articulate the short- and long-term nutrition-related outcomes (e.g., maternal and child dietary diversity, exclusive breastfeeding, consumption of fortified food vehicles) that interventions intend to affect and the ultimate intended nutrition status impacts (e.g., stunting, low birthweight, wasting, reduction in overnutrition and associated diseases) ().
2.6 Gender-Based Violence and Workplace Harassment Prevention and Treatment
Gender based violence (GBV) and workplace harassment are barriers to economic opportunity for many individuals, and can have a chilling effect on decisions to enter the labor market or engage in entrepreneurial activity. Their direct effects often manifest as poor physical and mental health that reduce both workplace productivity and overall socioeconomic welfare. CBA for interventions to counter GBV and workplace harassment should therefore explicitly incorporate expected effects on physical and mental health.
The ILO estimates that one in ten persons in employment have experienced physical violence and harassment at work in their lifetime, and one in fifteen have experienced sexual violence and harassment (8.2% of women and 5.0% of men). Youth, migrant, and wage and salaried5 women and men are particularly likely to experience workplace violence and harassment.6 Likewise, a 2014 poll found that about six in ten women using public transport systems in major Latin American cities experienced physical harassment,7 and similar figures have been observed in African8 and South Asian9 cities. This is reflected in perceptions of public transport safety, which tend to be lower in low and middle-income countries.10 Low-income countries also report higher lifetime and especially higher past year prevalence of intimate partner violence relative to high-income countries.11
The first MCC investment for which the benefits of violence prevention and treatment were modelled was the Lesotho II Health Sector Strengthening (HSS) project, which was expected to result in the prevention and improved treatment of gender based violence (GBV) outcomes. Benefits were expected to occur through three channels: (1) GBV prevention resulting in averted mortality and morbidity; (2) decreased transmission of HIV due to increased access to post exposure prophylaxis for sexual assault survivors; and (3) reduced emotional/psychological suffering (decreased depression) due to improved response from PHC providers. Details on this example are provided in Appendix A.
3. Approaches to the Valuation of Changes in Health Outcomes
This section provides general guidance for valuing changes in health outcomes (mortality and morbidity) that are forecast to result from an MCC intervention. Following the standard welfare theory underpinnings of CBA analysis, the approaches described below will rely to the greatest extent possible on an individual’s own willingness to pay (WTP) for marginal reductions in their risk of mortality or morbidity. When possible, WTP estimates should be calculated using real world market outcomes, which can “reveal” WTP for reduced mortality risk much more reliably than even the best designed WTP survey. Therefore, in these guidelines, “revealed preferences” are the preferred methodology for estimating WTP. The fundamental value per statistical life (VSL) estimates used in the Harvard methodology described below were estimated using “revealed preferences” for risk reduction based on consumer prices paid for goods with well established markets, like safety devices in vehicles. Very often, market failures (usually transaction costs) prevent many risks from having markets robust enough to generate “revealed preference” WTP estimates.
Absent a reliable revealed preference estimate, the main alternatives are to extrapolate a revealed preference based VSL estimate from an information rich environment (e.g. markets for vehicle safety features in high income countries) to an information poor environment using the best available evidence to guide the extrapolation. In the absence of a reliable VSL estimate (e.g. for most non-fatal risk reductions) we may recommend a methodology that does not rely on welfare theory but is market based.
In some cases (e.g. nutrition) there may be relevant incremental benefits not related to mortality or morbidity risk reduction. Again, estimates based on real world market outcomes are preferred, but often markets do not exist or are too thin to provide statistically valid estimates. When reliable alternatives exist they are recommended below.
When the evidentiary basis of a recommended methodology is not market based or otherwise not grounded on strong statistical evidence, the guidance below suggests possible approaches to sensitivity analysis to reflect the increased uncertainty associated with such estimates.
Section 3.1 provides guidance for valuing mortality risk reductions, while section 3.2 provides guidance for valuing nonfatal (morbidity) risk reductions.
3.1 Valuing Mortality Risk Reductions
Consistent with best practices outlined by Harvard University’s School of Public Health (HSPH), MCC recommends using the VSL for estimating the value of mortality risk reductions (Robinson et al. 2019). Reducing mortality risk decreases the expected number of deaths within a given time period and the VSL captures the average WTP for a small reduction in own mortality risk over the next year by this risk change. For example, if the average WTP for a 1/10,000 reduction in own mortality risk is $20, then the VSL is:
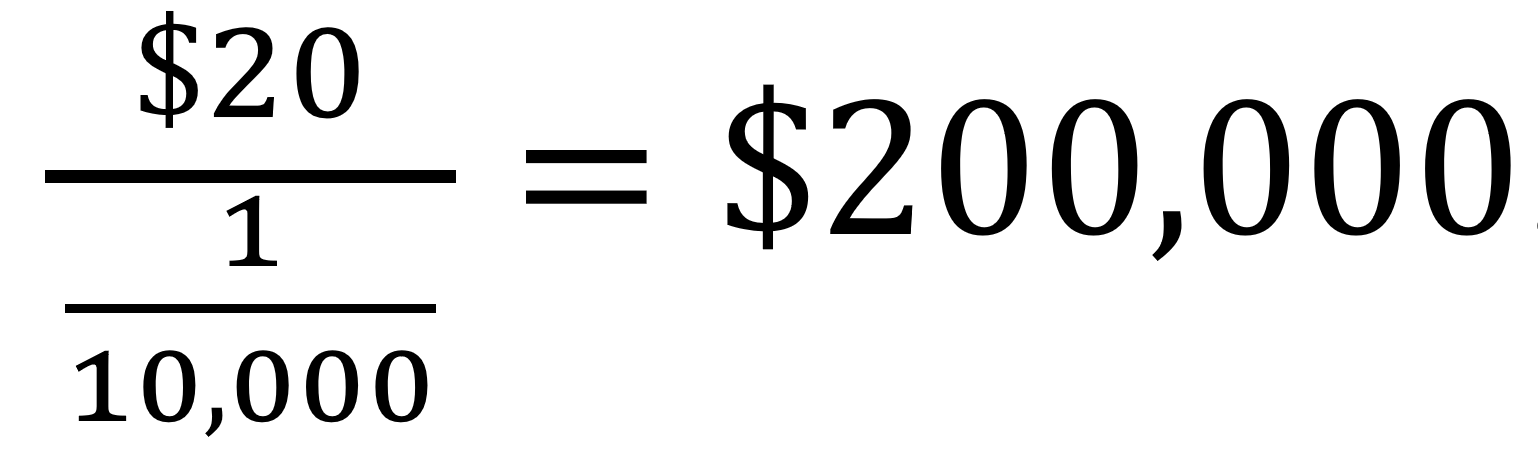
The VSL “represents the rate at which an individual views a change in the money he or she has available for spending as equivalent to a small change in his or her own mortality risk within a specific time period, such as one year” (Robinson et al. 2019).12 Importantly, VSL is not the value that the government or analyst places on saving a life. An advantage of the VSL methodology is that WTP presumably accounts for all of the potential benefits of small changes to wellbeing including monetary (e.g., avoided medical costs) as well as non-pecuniary (e.g., continuing to experience joy and avoid pain).
VSL estimates typically are derived from revealed or stated preference studies.13 While these studies are becoming more commonplace, with recent reviews finding over 200 such studies, most are still conducted in high-income contexts. A recent review of the literature found only 26 VSL studies conducted in low- or middle-income countries in the past 20 years, and the quality of these studies was varied (Robinson, Hammitt, & O’Keefe 2019). Given the unavailability of high quality VSL studies in most low and middle-income contexts and the substantial time and expense required to conduct high-quality VSL studies, the HSPH Guidelines recommend that, over the near-term, CBA practitioners working in low and middle-income contexts employ benefit transfer in which they extrapolate VSL parameters from VSL estimates in high-income country contexts, where numerous high-quality VSL studies are available. Assuming that demand for mortality risk reduction is decreasing with income (i.e., mortality risk reduction is a normal good), it is reasonable to assume that WTP for such mortality risk reduction decreases as income decreases. The following equation provides the benefit transfer method to adjust VSL estimates from high-income country contexts to low or middle-country contexts:
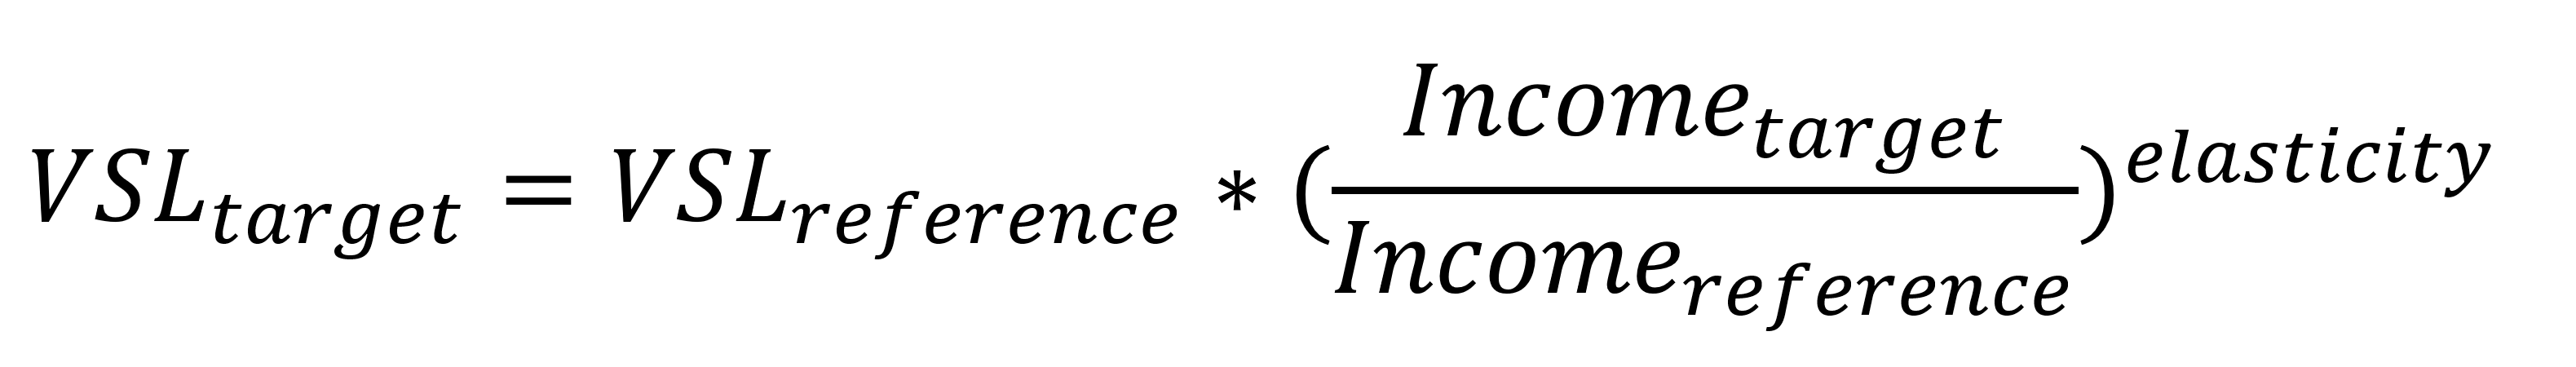
In this equation, VSLtarget refers to the low or middle-income country for which the VSL is being estimated, while VSLreference refers to the high-income country estimated VSL. Since most studies conducted in the United States use high quality revealed preference methods, we recommend using the United States as the reference country in analysis.14 The U.S. Department of Health and Human Services updated their VSL calculations in 2020 and found an average VSL of $11.4 million (2020 dollars).15 Incometarget and Incomereference refer to the PPP GNI per capita of the target and reference countries, respectively (US PPP GNI per capita in 2020 was $64,610 USD).
Elasticity is the estimate of the degree to which VSL changes with income (i.e., the income elasticity of the VSL). Following an extensive review of the literature (Robinson, Hammett, and O’Keefe 2018, 2019), the HSPH guidelines suggest a VSL income elasticity of 1.5. Note that an elasticity greater than one suggests that the ratio of VSL to GNI per capita is higher in higher-income populations than in lower-income populations, which one would expect given that lower-income populations must spend a greater proportion of their income on essential day-to-day expenses.
Since it may take several years for policy impacts to manifest, the VSL estimate should be adjusted over time based on the forecast GNI per capita growth for the target country. Following MCC guidelines and typical practice for policy applications, however, the VSL should not be adjusted for income differences within the country.16
3.2 Sensitivity Analysis for Valuing Mortality Risk Reductions
While the above approach should be applied in the base case analysis for purposes of assessment against MCC’s cost effectiveness thresholds, analysts have the option of exploring sensitivity of the economic rate of return to applying alternative methodological approaches to better inform the investment decision.
3.2.1 Sensitivity to the Benefit Transfer Calculation Approach
Given the importance of the elasticity parameter and the reference incomes in the VSL calculation, the HSPH guidelines suggest that the base analysis use the U.S. reference income and VSL target with an elasticity of 1.5 as outlined above, but that the analyst then conduct three additional sensitivity analyses.
- If the approach in the base case outlined above yields a VSL for the target country that is less than 20 times GNI per capita, then the analyst should instead estimate the VSL to be 20 times GNI per capita of the target country. The reasoning for this recommendation is that in such cases, it is likely that the VSL will exceed likely future income.
- In addition to the base case provided above, the analyst should use the OECD VSL estimates and an elasticity parameter of 1.0. The most recent VSL estimate from the OECD is $3 million, with an average GNI per capita of $30,600 (2005 US dollars) (OECD 2012). This is equivalent to calculating the target country VSL as 100*GNI per capita in the target country. Note in this case since the most recent OECD figures are in 2005 US dollars, the analyst should use the same adjustment for the GNI per capita in the target country.
- In addition to the base case provided above, the analyst should use the U.S. VSL estimates and an elasticity parameter of 1.0. This is equivalent to estimating the target country VSL as 176*GNI per capita in the target country.17 Note that the most recent US figures are in 2020 US dollars, so the analyst should use 2020 US dollars for the GNI per capita in the target country.
The base case analysis with an elasticity of 1.5 is preferred by the HSPH guidelines, because it accounts for the likelihood that fewer resources may be available to spend on mortality risk reductions in low-and middle-income countries. The sensitivity analyses described in #2 and #3 above account for research supporting a lower elasticity (between 1.0 and 1.2) in low-and middle-income countries (OECD 2016; World Bank and IHME 2016; Viscusi and Masterman 2017a, 2017b; Masterman and Viscusi 2018).18 The resulting VSLs from the sensitivity analyses conducted in #2 and #3 above are likely high for lower-income countries in which resources to spend on mortality risk reductions are constrained.
3.2.2 Sensitivity to Adjustments for Age and Life Expectancy
While the same VSL should be applied to risk reduction for all individuals in the population in the base case analysis for purposes of assessing cost-effectiveness, it may be appropriate for analysts to explore sensitivity to the application of approaches to adjust the VSL to correspond to the age and life expectancy of the target population. Given that the number of years of life remaining vary for individuals, one may reasonably expect higher VSLs for children or those that are younger in each population. Most of the research done to explore differences in VSL by age has been conducted in high-income country contexts.19 While findings vary substantially between studies, there does appear to be consensus that values for children are higher than for adults by as much as a factor of two. There is very little empirical evidence in low-income countries making it difficult to know if the same relationship holds in these contexts. As such, the HSPH Guidelines recommends use of value of statistical life year (VSLY) calculations for age-related sensitivity analysis, but not in the base case CBA. Further, given the paucity of quality empirical research, the HSPH Guidelines suggest that such sensitivity analysis is only warranted if the project or policy in question affects the very young or very old.
In such cases, the analyst should first calculate the population average VSL for the target country, and then calculate a constant VSLY by dividing the VSL by undiscounted future life expectancy at the average adult age in the population.20,21 The VSLY can then be multiplied by the change in life expectancy associated with the policy to estimate the value of the mortality risk reduction for specific age groups.
The following example is used to highlight the application of VSLY for sensitivity purposes. Consider a country in which the average age for an adult is 35 years, the life expectancy for the adult of average age is 30 years, and the population average VSL is $900,000. The VSLY for this case would be $900,000/30=$30,000 assuming future years are not discounted. Imagine a health policy that primarily targets children ages five and under. Children in this age range have a life expectancy of 60 years. The VSL for this age group is thus 60 × $3;0,000 = $1,800,000.
Ideally, the analyst would make use of life tables which calculate the conditional probability of surviving an additional year given that the individual has reached the age of the population targeted by the policy.
Many health-related projects in low-and middle-income countries target deaths around the time of birth. There is not strong research revealing parental willingness-to-pay to reduce the mortality risk of a fetus or newborn. For such projects, the analyst may apply the VSLY estimates described above to deaths that occur during childbirth or immediately after birth. In such cases, the analyst would apply the VSLY estimate the life expectancy in the country at age zero. The HSPH guidelines recommend valuing deaths that occur prior to birth (in utero) at zero, with sensitivity analyses that experiment with different positive values applied to these deaths.
3.3 Valuing Nonfatal (Morbidity) Risk Reductions
To value nonfatal (that is, morbidity) risk reduction, the economist faces a choice between relying on WTP—an individual’s own judgement of the marginal benefit of a reduction in their risk of morbidity—or relying on the (at times) more easily measured Cost of Illness (COI). COI relies on estimates of direct costs like healthcare fees, medication, rehabilitation, and indirect productivity losses like absence from work, or reduced productivity while at work. COI does not measure the welfare impacts of pain and suffering and other quality of life issues.
The WTP methodology hews closely to the welfare-economics based theoretical underpinnings of CBA. For non-fatal risk reductions, MCC CBA should rely on WTP estimates when they already exist, or a timely and cost-effective WTP study can be implemented by EA. The analyst should apply a similar benefit transfer method as elucidated in Section 3.1 above. However, WTP studies of the non-fatal effects of various diseases tend to require more statistical power than can be provided cost effectively to measure the non-fatal effects of every illness of interest to the policy maker. For MCC this means that WTP studies for a particular illness in a particular country are unlikely to exist, and engaging in a WTP study to measure health benefits of non-fatal diseases may not be cost effective or sufficiently timely. In such cases, the most evidence-based alternative is a Cost of Illness approach, despite the risk of underestimating benefits through the omission of quality-of-life related welfare effects.
3.3.1 Cost of Illness Approach
Cost of illness calculations include both direct medical costs and indirect productivity loss. Vassall et al. (2017) provide guidance for how to calculate direct medical costs, such as expenditures on health care providers, medication, hospital stays, and other treatment-related activities, in low- and middle-income countries. Indirect productivity costs include work absences, loss of productivity at work, and decreases in unpaid work. Indirect costs may also include productivity losses from those that provide caregiving services, such as family members.
The opportunity cost of time spent sick or on caregiving activities is best measured using the relevant wage, for both monetized and non-monetized labor. The economist should determine who is providing care – men, women, or children – and in what proportion. For adult men and women, the relevant wages from a recent labor force survey should be used. Often wages for children are not available (e.g., child labor is illegal in the country), in which case a rule of thumb is to use 50% of the wage for unskilled labor.
Even when a WTP study is available, some costs avoided are incremental to an individual’s WTP to avoid non-fatal disease, including medical costs paid by third parties as well as the opportunity costs of caregiving provided by family or friends. These costs can be added to the WTP estimates, with special attention paid to double counting, as most costs of illness are borne by the individual and are included in the WTP estimate.
3.4 Sensitivity Analysis for Valuing Nonfatal (Morbidity) Risk Reductions
While the above approach should be applied in the base case analysis for purposes of assessment against MCC’s cost effectiveness thresholds, analysts have the option of exploring sensitivity of the economic rate of return to applying alternative methodological approaches to better inform the investment decision.
3.4.1 Sensitivity to Application of a DALY-Based Methodology
Given the potential for the COI approach to underestimate benefits, the HSPH guidelines encourage using the monetized estimates of changes in disability-adjusted life years DALYs as a sensitivity analysis. DALYs are based on quality-adjusted life years (QALYs). To derive QALYs, one multiplies the amount of time that an individual spends in a health state by the associated health-related quality of life (HRQL). HRQL ranges from zero to one, with one corresponding to full health and zero corresponding to a state that is as bad as dead.22 The HSPH guidelines recommend that analysts use the HRQL weights provided in Saloman (2015).
DALYs are a similar measure that are often used in cost-effectiveness analyses of health interventions. They are based off of a scale that inverts the QALY scale such that zero represents full health and one is equivalent to dead. For example, a year with a disability weight of 0.4 is equivalent to 60% of a year in full health. The disability weight is then multiplied by the years that the individual is expected to live with the condition to obtain the years lived with disability (YLDs). The HSPH guidelines recommends that the analyst use recently estimated disability weights provided in Salomon et al. (2015).23 To estimate the value of risk reduction, the analyst should multiply the projected change in DALYs by the VSLY.
4. Tools and Methods for Forecasting Changes in Health Outcomes
This section recommends tools and methods to forecast the change in health outcomes (mortality and morbidity) likely to result from an MCC intervention. In order to apply the guidance in section 3 to value the benefits of reduced mortality and nonfatal (morbidity) risk, analysts must quantify the magnitude of the change in mortality and morbidity that is forecasted to result from the intervention under analysis. This section may be expanded over time as additional tools and methods become available.
4.1 Health Systems Strengthening Forecasts
The OneHealth Tool, overseen by the UN Interagency Working Group on Costing (IAWG-Costing), was designed to strengthen health system costing and impact analysis for low and middle-income countries.24 It provides a single framework for planning, costing, impact analysis, budgeting and financing of strategies for major diseases and health system components. It combines previous costing tools and uses a modular design to allow for program-specific and sector-wide costing. The data and tool are updated regularly and are publicly available. In particular, the OneHealth Tool allows the user to input baseline data and intervention targets for changes to any of the following of the health system components: human resources, infrastructure, health financing, health information systems, governance, as well as a series of disease-specific interventions. The user can also specify the impact modules from which default data should be loaded. Table B.1 in Appendix B offers a brief description of each impact module.
The CBA for the Health Systems Strengthening (HSS) Project under the Lesotho II Compact (not yet published)25, applied the OneHealth Tool to project health outcome improvements resulting from increased primary health care services. Specifically, it applied the Lives Saved Tool (LiST) (Clarmont and Walker 2017), which forecasts the effect of increased maternal and child health service delivery coverage on health outcomes, and the non-communicable disease module (NCD), which forecasts the effect of increased cardiovascular disease and diabetes related service delivery coverage on health outcomes. These were the areas that were deemed most likely to be affected by the primary health improvements expected to result from the Lesotho II HSS Project. Analysts can similarly choose OneHealth Tool modules most appropriate for their country context and project type to forecast changes in health outcomes likely to result from the intervention under analysis. The valuation methods described in Section 3 can then be applied to value the forecasted changes in mortality and morbidity.
4.2 Air Quality Improvement Forecasts
Numerous approaches of various complexity have been developed to forecast the impact of changes in air quality on health outcomes. Among the most widely applied are the Environmental Benefits Mapping and Analysis Program - Community Edition (BenMAP - CE) of the United States Environmental Protection Agency (U.S. EPA) and the World Health Organization’s AirQ+. A large number of peer-reviewed articles and technical reports have used and reported on both tools, which is evidence of their complementary capabilities in terms of the kinds of studies and questions each can address. Out of the 12 computer tools examined BenMAP-CE and AirQ+ are found to be the most intuitive and user friendly (Anenberg et al. 2016). While both tools have different characteristics and attributes, they can produce similar results in estimating the health impact of poor air quality if similar data are used (Mirzaei et al. 2021; Sacks et al. 2020).
Both tools are open source and are designed to calculate the health effect of changes to air pollution exposures in given populations. BenMAP-CE is more user-friendly. The POPSIM module, the international module of BenMAP-CE, uses country-specific lifetables to quantify the number of PM2.5 attributable life years gained, deaths avoided, and improved life expectancy at birth. BenMAP-CE is limited in that it only considers three common pollutants: PM2.5, PM10 and O3. AirQ+ considers a broader range of pollutants (PM2.5, PM10, NO2, O3, Black Carbon), as well as the health effects from solid fuel exposure. AirQ+ considers the short and long-term effects of changes in concentrations of pollutants both for mortality and morbidity, using a range of acute and chronic conditions. Given the similarity in results from the two software programs, we recommend BenMAP-CE and POPSIM in most cases. For projects that target household air pollution, AirQ+ may be more appropriate.26 Using the mortality and morbidity forecasts from the tools, analysts can then apply the valuation methods described in Section 3 above. Data used and output measures produced by each of the tools can be found in Appendix C (Table C.1, Table C.2)
For the purposes of CBA calculations, understanding the timing of the health benefits produced by the AirQ+ and BenMAP-CE models is critical. For PM2.5 reductions, EPA recommends the following mortality cessation lags: 30% of deaths reduced in the first year, 50% of deaths evenly distributed between years 2-5, and the remaining mortality benefits occurring evenly between years 6-20.27
4.3 Forecasts for Other Intervention Types
For interventions for which pre-existing forecasting tools and methods are not yet specified here, analysts should rely on data from the context of interest and similar contexts; the best available evidence from systematic reviews, peer reviewed publications and other publications as appropriate; and expert elicitation. The Lesotho II GBV Prevention and Treatment CBA Methodology provides an example of this approach for an intervention to counter GBV. This CBA modelled benefits from 1) GBV prevention resulting in averted mortality and morbidity; (2) decreased transmission of HIV due to increased access to post exposure prophylaxis for sexual assault survivors; and (3) reduced emotional/psychological suffering (decreased depression) due to improved response from PHC providers. See Appendix A for additional detail.
5. Distributional Impacts
Following the estimation of total benefits, one may be interested in understanding which groups may be particularly advantaged or disadvantaged by the project. MCC has standard Beneficiary Analysis Guidance which provides general guidance on the conceptualization and calculation of the distribution of benefits between interventions’ targeted beneficiaries. That Guidance details the construction of the main distributional tools that MCC uses in its CBAs: the Poverty Scorecard, the Beneficiary Analysis, and the Beneficiary Analysis bar chart.
The first consideration is identifying how changes in mortality and/or morbidity are allocated across subpopulations of concern. Such allocation will depend on both the effectiveness of the policy in reducing risks faced by individuals within each subpopulation as well as the baseline distribution of these risks (HSPH Guidelines). In certain instances, existing research may provide data on the distribution. For example, AirQ+ software allows for subnational estimation of health benefits from air pollution changes. In the absence of existing distributional analyses within the risk assessment and disease modeling, analysts will need to rely on other sources to develop plausible assumptions.
Following the estimation of how mortality and/or morbidity changes are allocated across subpopulations, the next step is to estimate the monetary value of these risk reductions roughly as outlined in Section 3. While the base case estimate of total benefits should apply population-average VSL values, however, the distributional analysis should instead attempt to adjust VSL values to reflect the preferences of individuals within different subgroups. Relying on population averages likely overstates the values for poorer individuals and understates the values for wealthier individuals. The HSPS Guidelines recommend that the same approach for adjusting WTP to reflect income differences across countries (see Section 3.1) be applied to adjust for income differences within a country for the purposes of distributional analysis. Importantly, such estimates measure the individuals’ willingness to trade their own income for a change in their own health or longevity, and “are not the value that the government or the analyst places on averting certain death or illness or injury, nor are they a measure of moral worth. Without such adjustment, the results could be mistakenly interpreted as supporting a policy that does not align with the preferences of those affected.” (HSPH Guidelines).
Once the monetization of benefits by subgroup is complete, the analyst can then fully incorporate the distributional analysis into the MCC Beneficiary Analysis and Poverty Scorecard as detailed in the Beneficiary Analysis Guidance.
Bibliography
Avenir Health and Johns Hopkins University (2023). OneHealth Manual: A system to create short and medium term plans for health services.
https://avenirhealth.org/Download/Spectrum/Manuals/OneHealthManualE.pdf
Anenberg, S. C., Belova, A., Brandt, J., Fann, N., Greco, S., Guttikunda, S., ... & Van Dingenen, R. (2016). “Survey of ambient air pollution health risk assessment tools.” Risk analysis, Vol. 36, No. 9: 1718-1736.
Zulfiqar, Jai Das, Argumand Rizvi, et al. (2013). “Evidence-based interventions for improvement of maternal and child nutrition: what can be done and at what cost?” Lancet, Vol. 382: 452-77.
Barasa, E. W., Ayieko, P., Cleary, S., & English, M. (2012). “A multifaceted intervention to improve the quality of care of children in district hospitals in Kenya: a cost-effectiveness analysis.” PLoS Medicine, Vol. 9, No. 6: e1001238.
Ceccato, V., & Loukaitou-Sideris, A. (2022). Fear of sexual harassment and its impact on safety perceptions in transit environments: a global perspective. Violence against women, 28(1), 26-48.
Chang, A., Horton, S., Jamison, D. T (2017). “Benefit-Cost Analysis in Disease Control Priorities, Third Edition”. In: Disease Control Priorities (third edition): Volume 9, Disease Control Priorities, edited by D. T. Jamison, H. Gelband, S. Horton, P. Jha, R. Laxminarayan, C. N. Mock, R. Nugent. Washington, DC: World Bank.
Cleary, S. (2020). “Economic evaluation and health systems strengthening: a review of the literature.” Health Policy and Planning, Vol. 35, No. 10:1413–1423.
The Commonwealth. (2020). The Economic Cost of Violence Against Women and Girls A Study of Lesotho. Commonwealth Secretariat.
Desai, S., Alva, S. (1998). “Maternal education and child health: is there a strong causal relationship?” Demography, Vol. 35, No. 1: 71-81.
Dix-Cooper L, Eskenazi B, Romero C, Balmes J, Smith KR (2012) “Neurodevelopmental performance among school age children in rural Guatemala is associated with prenatal and postnatal exposure to carbon monoxide, a marker for exposure to woodsmoke.” Neurotoxicology, Vol. 33: 246–254.
Keats EC, Das JK, Salam RA, Lassi ZS, Imdad A, Black RE, Bhutta ZA. Effective interventions to address maternal and child malnutrition: an update of the evidence. Lancet Child Adolesc Health. 2021 May;5(5):367-384. doi: 10.1016/S2352-4642(20)30274-1. Epub 2021 Mar 7. PMID: 33691083.
FAO, IFAD, UNICEF, WFP and WHO (2022). The State of Food Security and Nutrition in the World 2022. Repurposing food and agricultural policies to make healthy diets more affordable. Rome, FAO.
Global Nutrition Report (2022). 2022 Global Nutrition Report: Stronger Commitments for Greater Action. https://globalnutritionreport.org/.
Grépin, K. A., Bharadwaj, P. (2015). Maternal education and child mortality in Zimbabwe. Journal of health economics, Vol. 44: 97-117.
Goeman, L., Galichet, B., Porignon, D.G., Hill, P.S., Hammami, N., Essengue Elouma, M., Kadama, P.Y., Van Lerberghe, W. (2010). “The response to flexibility: country intervention choices in the first four rounds of the GAVI Health Systems Strengthening applications.” Health Policy and Planning, Vol. 25, No. 4: 292–299.
Güneş, P. M. (2015). “The role of maternal education in child health: Evidence from a compulsory schooling law.” Economics of Education Review, Vol. 47: 1-16.
Hauck, K., Morton, A., Chalkidou, K., Chi, Y.L., Culyer, A., Levin, L., Meacock, R., Over, M., Thomas, R., Vassall, A., Verguet, S., Smith, P.C. (2019). “How can we evaluate the cost-effectiveness of health system strengthening? A typology and illustrations.” Social Science & Medicine, Vol. 220: 141-149.
Hammitt, J. K. (2000). “Valuing mortality risk: theory and practice.” Environment, Science, & Technology, Vol. 34, No. 8: 1396-1400.
Hernandez, Jose Bien R., and Peggy Y. Kim. “Epidemiology Morbidity And Mortality.” StatPearls Publishing, 2022. https://www.ncbi.nlm.nih.gov/books/NBK547668/
International Labor Organization (2022): Experiences of violence and harassment at work: A global first survey, Geneva: ILO, 2022.
Kacharo, D. K., Teshome, E., & Woltamo, T. (2022). Safety and security of women and girls in public transport. Urban, planning and transport research, 10(1), 1-19.
Keats, Emily, Jai Das, Rehana Salam, et al. (2021). “Effective interventions to address maternal and child malnutrition: an update of the evidence.” Lancet Child Adolesc Health, Vol 5:367-84.
Kingkaew, P., Werayingyong, P., Aye, S. S., Tin, N., Singh, A., Myint, P., & Teerawattananon, Y. (2016). “An ex-ante economic evaluation of the Maternal and Child Health Voucher Scheme as a decision-making tool in Myanmar.” Health Policy and Planning, Vol. 31, No. 4: 482-492.
Hoddinott, John, Harold Alderman, Jere R. Behrman, Lawrence Haddad, and Susan Horton. (2013). “The Economic Rationale for Investing in Stunting Reduction.” Maternal & Child Nutrition, Vol. 9, No. S2:: 69–82.
Horton, Susan, and Carol Levin. 2016. “Cost-Effectiveness of Interventions for Reproductive, Maternal, Neonatal, and Child Health.” In Reproductive, Maternal, Newborn, and Child Health: Disease Control Priorities, Third Edition (Volume 2), edited by Robert E. Black, Ramanan Laxminarayan, Marleen Temmerman, and Neff Walker. Washington (DC): The International Bank for Reconstruction and Development / The World Bank.
Landrigan, P.J. (2017). “Air pollution and health.” The Lancet, Vol 2, No. 1: E4-E5.
Le, K., & Nguyen, M. (2020). “Shedding light on maternal education and child health in developing countries.” World Development, Vol. 133: 105005.
Makate, M., Makate, C. (2016). “The causal effect of increased primary schooling on child mortality in Malawi: Universal primary education as a natural experiment.” Social Science & Medicine, 168: 72-83.
Malley, C. S., Kuylenstierna, J. C., Vallack, H. W., Henze, D. K., Blencowe, H., Ashmore, M. R. (2017). “Preterm birth associated with maternal fine particulate matter exposure: a global, regional and national assessment.” Environment International, Vol. 101: 173-182.
Martin, W. J., Glass, R. I., Araj, H., Balbus, J., Collins, F. S., Curtis, S., ... & Bruce, N. G. (2013). “Household air pollution in low-and middle-income countries: health risks and research priorities.” PLoS Medicine, Vol. 10, No. 6: e1001455.
Masterman, C., Viscusi, K. (2018). “The Income Elasticity of Global Values of a Statistical Life: Stated Preference Evidence.” Journal of Benefit-Cost Analysis, Vol. 9, No. 3: 407–434.
McEwan, P. J. (2012). “Cost-effectiveness analysis of education and health interventions in developing countries.” Journal of Development Effectiveness, Vol. 4, No. 2: 189-213.
Mensch, B. S., Chuang, E. K., Melnikas, A. J., Psaki, S. R. (2019). “Evidence for causal links between education and maternal and child health: systematic review.” Tropical Medicine & International Health, Vol. 24, No. 5: 504-522.
Mirzaei, A., Tahriri, H., & Khorsandi, B. (2021). “Comparison between AirQ+ and BenMAP-CE in estimating the health benefits of PM 2.5 reduction.” Air Quality, Atmosphere & Health, Vol. 14: 807-815.
Morton, A., Thomas, R., Smith, C. (2016). “Decision rules for allocation of finances to health systems strengthening.” Journal of Health Economics, Vol. 49: 97-108.
Mulligan, J. A., Yukich, J., Hanson, K. (2008). “Costs and effects of the Tanzanian national voucher scheme for insecticide-treated nets.” Malaria Journal, Vol. 7: 1-10.
OECD. Economic Consequences of Outdoor Air Pollution. Paris: OECD Publishing; 2016
Office of Management and Budget Circular A-4 (Draft for Public Review) (2023)
Pope DP, Mishra VK, Thompson L, Siddiqui AR, Rehfuess E, et al. (2010). “Risk of low birth weight and stillbirth associated with indoor air pollution from solid fuel use in developing countries.” Epidemiologic Review, Vol. 32, No. 1: 70-81.
Robinson, L., Hammitt, J., O’Keeffe, L. (2018). “Valuing Mortality Risk Reductions in Global Benefit-Cost Analysis”. Guidelines for Benefit-Cost Analysis Project, Working Paper No. 7
Robinson, L.A., J.K. Hammitt, M. Cecchini, K. Chalkidou, K. Claxton, M. Cropper, P. Hoang-Vu Eozenou, D. de Ferranti, A.B. Deolalikar, F. Guanais, D.T. Jamison, S. Kwon, J.A. Lauer, L. O’Keeffe, D. Walker, D. Whittington, T. Wilkinson, D. Wilson, and B. Wong. Reference Case Guidelines for Benefit-Cost Analysis in Global Health and Development, funded by the Bill & Melinda Gates Foundation, 2019. https://cdn1.sph.harvard.edu/wp-content/uploads/sites/2447/2019/05/BCA-Guidelines-May-2019.pdf
Robinson, L., Hammitt, J., O’Keeffe, L. (2019). “Valuing Mortality Risk Reductions in Global Benefit-Cost Analysis.” Journal of Benefit-Cost Analysis, Vol. 10, No. S1: 15-50.
Robinson, L. A., Raich, W. J., Hammitt, J. K., & O’Keeffe, L. (2019). “Valuing children’s fatality risk reductions.” Journal of benefit-cost analysis, Vol. 10, No. 2: 156-177.
Rowe, A. K., Rowe, S. Y., Peters, D. H., Holloway, K. A., Chalker, J., Ross-Degnan, D. (2018). “Effectiveness of strategies to improve health-care provider practices in low-income and middle-income countries: a systematic review.” The Lancet Global Health, Vol. 6, No. 11: e1163-e1175.
Ruel, Marie, Harold Alderman, and the Maternal and Child Nutrition Study Group. (2013). “Nutrition-sensitive interventions and programmes: how can they help to accelerate progress in improving maternal and child nutrition?” Lancet, Vol. 382:536-51.
Sacks, J. D., Fann, N., Gumy, S., Kim, I., Ruggeri, G., & Mudu, P. (2020). “Quantifying the Public health benefits of reducing air pollution: Critically assessing the features and capabilities of WHO’s AirQ+ and US EPA’s environmental benefits mapping and analysis program—Community edition (BenMAP—CE).” Atmosphere, Vol. 11, No. 5: 516.
Salomon, J. A., Haagsma, J. A., Davis, A., de Noordhout, C. M., Polinder, S., Havelaar, A. H., ... & Vos, T. (2015). “Disability weights for the Global Burden of Disease 2013 study.” The Lancet Global Health, Vol. 3, No. 11: e712-e723.
Sardinha, L., Maheu-Giroux, M., Stöckl, H., Meyer, S. R., & García-Moreno, C. (2022). Global, regional, and national prevalence estimates of physical or sexual, or both, intimate partner violence against women in 2018. The Lancet, 399(10327), 803-813.
Thomas, D., Strauss, J., & Henriques, M. H. (1991). “How does mother’s education affect child height?” Journal of human resources: 183-211.
UNICEF. Clean Air for the Children. New York: UNICEF: 2016.
UN Women. Kigali Safe City for Women and Girls: Baseline Survey Report; 2013.
Vassall, Anna, Sedona Sweeney, Jim Kahn, Gabriela B. Gomez, Lori Bollinger, Elliot Marseille, Ben Herzel, Willyanne DeCormier Plosky, Lucy Cunnama, Edina Sinanovic, Sergio Bautista-Arredondo, GHCC Technical Advisory Group, GHCC Stakeholder Group, Kate Harris, and Carol Levin. 2017. Reference Case for Estimating the Costs of Global Health Services and Interventions.
Viscusi, K., Masterman, C. (2017a). “Anchoring Biases in International Estimates of the Value of a Statistical Life.” Journal of Risk and Uncertainty, Vol. 54, No. 2:103–128.
Viscusi, K., Masterman, C. (2017b). “Income Elasticities and Global Values of a Statistical Life.” Journal of Benefit-Cost Analysis, Vol. 8, No. 2: 226–250.
Warren, A.E., Wyss, K., Shakarishvili, G., Atun, R., de Savigny, D. (2019). “Global health initiative investments and health systems strengthening: a content analysis of global fund investments.” Globalization and Health, Vol. 9, No. 30.
Wong, B., & Radin, M. (2019). Benefit-cost analysis of a package of early childhood interventions to improve nutrition in Haiti. Journal of Benefit-Cost Analysis, Vol. 10, No. S1: 154-184.
World Bank and IHME: The Cost of Air Pollution: Strengthening the Economic Case for Action. Washington, DC: The World Bank; 2016.
World Health Organization: Everybody’s business: strengthening health systems to improve health outcomes. WHO’s Framework for Action. Geneva: World Health Organization; 2007. https://www.who.int/publications/i/item/everybody-s-business----strengthening-health-systems-to-improve-health-outcomes
Environment Protection Agency, Quantifying the Public Health Benefits of Reducing Air Pollution: Critically Assessing the Features and Capabilities of WHO’s AirQ+ and U.S. EPA’s Environmental Benefits Mapping and Analysis Program – Community Edition (BenMAP – CE), 2021. World Health Organization (2009) Global health risks. Mortality and burden of disease attributable to selected major risks. Geneva, WHO.
Yasir, S., Ahmad, T., & Enam, A. (2022). An analysis of the harassments and challenges faced by the public transport users in a developing country of South Asia. Frontiers in Built Environment, 8, 1049121.
Appendix A: MCC Health Sector Projects
Below are descriptions of prior/ongoing MCC Compact health projects. This table does not include WASH and power projects, which may also generate health benefits. Likewise, the table does not include the Indonesia or Kosovo Threshold Program health projects for which CBAs were not required.
| Country | Type of Project(s) | Status | Entry into Force Date |
|---|---|---|---|
| Mongolia | Health system strengthening | Closed | 9/17/2008 |
| Lesotho | Health system strengthening + HIV/AIDS prevention and treatment | Closed | 9/17/2008 |
| Indonesia I | Community-based health and nutrition | Closed | 4/2/2013 |
| Lesotho II | Health system strengthening + gender-based violence prevention/treatment | Signed | 3/31/2024 (planned) |
Mongolia
As part of MCC’s $284.9 million compact with Mongolia (2008 – 2013), a $42 million investment helped to strengthen the national program for prevention, early diagnosis, and management of non-communicable diseases and injuries. Mongolia had seen death rates from premature heart disease, stroke, diabetes and pedestrian traffic accidents rise precipitously over the decade preceding the compact. The MCC- funded public health intervention worked with private industry to promote better health for the country’s people, leading to a number of improvements, including a reduction of salt, sugar and fat in popular food brands. At compact completion, the two major Mongolian bread factories had reduced salt content in their products by 12 percent, and a leading dairy producer now offers five reduced- sugar and three sugar-free products. MCC’s investments also supported new food labeling standards to protect and inform consumers.
The Project aimed to reduce rates of NCDI through 1) research on NCDI related behaviors and practices, 2) communications and education interventions to promote risk behavior changes, 3) new treatment and disease management protocols, 4) a limited amount of equipment and intensive in-service training for early detection of cervical and breast cancers, and 5) training of physicians and medical personnel in NCDI disease management. To calculate health benefits in the ERR, the model estimated avoided deaths by cause and age range and multiplied the remaining years at working age by GDP per capita and annual projected economic growth rate. This approach has the obvious downside of assuming zero benefits for avoided deaths for those above working age. The ERR also incorporated treatment cost savings from reductions in the prevalence and severity of NCDI.
Link to Mongolia ERRs: Mongolia Compact | Millennium Challenge Corporation (mcc.gov)
Lesotho
The Health Sector Project in the Lesotho I Compact was designed to mitigate the negative economic impacts of poor maternal health, HIV/AIS, tuberculosis (TB) and other diseases by strengthening the country’s health care infrastructure. Specifically, the Project renovated and equipped outpatient health departments and other medical infrastructure. It also increased the capacity of mobile blood collection units and trained health practitioners in infection, prevention, and disease control.
The CBA model estimates the future life years lived by age and sex given improvements to ART coverage, prevention of mother-to-child transmission, and maternal and child health services. Like the Mongolia model, health benefits are valued as life years gained multiplied by GDP per capita.
Link to Lesotho I ERRs: Lesotho Compact | Millennium Challenge Corporation (mcc.gov)
Indonesia
The Nutrition Project in Indonesia was designed to reduce and prevent low birth weight, childhood stunting, and malnourishment of children and to increase household income through cost savings, productivity growth, and higher lifetime earnings. The project consisted of three main activities. The Community Projects Activity provided community block grants to improve access to health and early childhood education at the village level. The Supply Side Activity consisted of training to service providers, sanitation and hygiene activities, provision of multiple micronutrient packets, and materials to measure children’s height. Finally, the Communications, Project Management and Evaluation Activity included communications providing mass media and training for interpersonal communication at the community level aimed to increase awareness of stunting, evoke commitments from stakeholders to tackle stunting, and foster behavior change related to health, nutrition, and sanitation.
The CBA model took a COI approach, estimating the expenses saved from cases of diarrhea and chronic diseases averted. The ERR for the Nutrition Project is not yet published.
Lesotho II
The Health Systems Strengthening Project consists of three main activities. First, the Primary Health Care (PHC) Service Provision aims to improve the patient record system, update clinical competencies and standards of care including Gender-Based Violence (GBV) prevention and response, and develop clear referral guidelines at each level of care. The District Health Management Team (DHMT) Reform activity will build capacity of DHMT to monitor and evaluate spending vs. performance. Finally, the Digital Health activity will improve health data systems to improve the current and future workforce capacities to analyze and use health data. The policy and institution reforms (PIR) implemented through the investment are expected to strengthen the health system in ways that indirectly improve the quality and efficiency of health service delivery, which is in turn expected to improve health outcomes and cost savings.
This was modelled as an increase in PHC service delivery coverage for roughly 75 primary health services in the areas of pregnancy, breastfeeding, childbirth, periconception, nutrition and hygiene, vaccination, curative treatments, cardio-vascular disease, and diabetes. The cost and change in health outcomes resulting from this coverage increase were forecast using the OneHealth Model Lives Saved Tool and Non-Communicable Disease Modules. The approach detailed in section 3 above was then applied to value the forecast change in mortality and morbidity. The CBA also modelled cost-savings expected to result from increased efficiency resulting from introduction of a referral system. Finally, the CBA incorporated benefits of GBV prevention and treatment expected to result from the investment in the form of (1) averted mortality and morbidity; (2) decreased transmission of HIV due to increased access to post exposure prophylaxis for sexual assault survivors; and (3) reduced emotional/psychological suffering (decreased depression) due to improved response from PHC providers (see a detailed description below). The CBA for the Lesotho II project is not yet published.
Modelling the Benefits of Violence Reduction in Lesotho:
The Lesotho II GBV Prevention and Treatment CBA Methodology (Bowen and Schubert 2022) modelled benefits from 1) GBV prevention resulting in averted mortality and morbidity; (2) decreased transmission of HIV due to increased access to post exposure prophylaxis for sexual assault survivors; and (3) reduced emotional/psychological suffering (decreased depression) due to improved response from PHC providers.
1. GBV Prevention
The model applied the Value of Statistical Life (VSL) concept to value forecast mortalities averted as a result of GBV prevention and a cost-of-illness (COI) approach to value forecast morbidities averted as a result of GBV prevention (reduction in non-fatal illnesses), as described in section 3.
For purposes of the GBV COI calculations, averted productivity loss at work and at home was based on estimates for the percentage of victims who took off work (19.1%) or neglected household duties (29.2%) in the previous 12 months due to an injury, and the weighted average number of days for each woman who missed work (10.9 days) or had household duties disrupted (6.0 days). Professional or household work missed was valued based on the economic opportunity cost of time estimated using the 2017-2018 Lesotho Household Budget Survey.
Averted costs of care were calculated assuming that all women suffering grievous injuries (1% of those experiencing GBV) and 52% of women experiencing medium injuries (5.3% of those experiencing GBV) will go to a clinic. The Commonwealth (2020) estimates personal out-of-pocket expenses for the resulting transportation, ambulance calls, tests, diagnostic treatment and medicine, and inpatient services and the percentage of women who experienced these costs, which was used to calculate the weighted average cost for all women experiencing injuries and going to a clinic. A weighted average for outpatient costs at the PHC level for the provider was also estimated from the total spending per outpatient.
2. Decreased transmission of HIV due to increased access to post exposure prophylaxis (PEP)
Second, the HSS investment is expected to increase access to PEP, which is promoted by the United Nations Package of Essential Services. Data for Lesotho suggests that nearly 2,900 individuals were using PEP between August 2020 and July 2021. While it is not possible to say how many of these individuals are using PEP following an incidence of sexual GBV, due diligence experts believe roughly 20% of those individuals may be victims of sexual assault. Applying the above figures for the prevalence of sexual GBV and women who are likely to go to the clinic, along with data for the percentage of women who do not currently have HIV, suggests that roughly 58% of sexual assault victims who go to the clinic currently receive PEP. The HSS activity is expected to lead to 90% of sexual assault victims having access to PEP, which is in turn expected to result in averted HIV transmission. The model also assumed that a share of women who avert sexual GBV through the first benefit stream will in turn avert HIV transmission, which is accounted for under this benefit stream.
The CBA forecasted the likelihood that a sexual GBV event would lead to HIV exposure based on the percentage of sexually violent events that lead to HIV transmission and the percentage of men aged 15-59 in Lesotho who have HIV. It was assumed that this is the population who will be offered PEP. Data from Nairobi, Kenya was used to estimate the percentage of women who will complete the full PEP course (34%), and some evidence suggests that successfully completing PEP will reduce HIV transmission by 81%.
The averted cost of care expected to result from reduced HIV transmission was calculated based on a Lesotho study on the standard care for HIV patients, which calls for three-month, facility-based refills. This suggests patients visit the health facility every three months and receive a three-month supply of ART at a time. Provider costs are per female patient treated and include facility visits, viral load, and ART medication. Patient costs were also derived from this study and take into account the need to take an entire day to visit a healthcare facility (opportunity costs) and costs of transport. This calculation does not include costs to treat side effects of the drug or counselling. All averted HIV cases were expected to result in averted costs of care for 20 years due to long lifespans using these drugs.
3. Reduced psychological suffering due to improved response from PHC providers
Third, the HSS investment was expected to reduce the psychological suffering of GBV victims through improved treatment at PHC facilities. The CBA assumed improved treatment will lead to a 10% reduction in depression based on the limited evidence available, including studies on the effects of PHC-level interventions to treat depression unrelated to GBV.
As discussed above, the HSS activity also plans to improve the referral system, which will include referral of GBV victims to social services. Since mechanisms for referral to social services and care do not currently exist except in a limited, informal fashion, it was assumed that only 3% of GBV victims received social services at baseline. Due diligence experts expected that the HSS investment will lead to 30% of GBV victims treated in a public PHC receiving a referral to social services, and that 50% of those receiving a referral will choose to pursue those services. In turn, 10% percent of those accessing these services as a result of the investment were expected to experience reduced depression (a benefit incremental to averted depression resulting from improved PHC-level care).
Averted depression was in turn expected to result in averted productivity loss at work. Limited evidence from other contexts suggests that 51% of women who experience a physical or sexual GBV event will experience moderate or severe depression, which was assumed to lead to one depressive episode each year. Data from South Africa suggests that the average woman with depression will miss 3.3 days at work during a depressive episode. Averted days of work lost were valued using the COI approach described above under Benefit 1.
Appendix B: OneHealth Tool Modules
| Module Name | Module Description | Resources for More Information (if applicable) | Notes |
|---|---|---|---|
| DemProj | Projects the population for a country or region by age and sex, based on assumptions about fertility, mortality, and migration. Uses data from the United Nations Population Division. Fertility and mortality changes produced by health programs which are calculated in the impact models are fed into DemProj, which then revises population projections and vital events accordingly. | DemProj 4-12 ver 3.doc (jhsph.edu) | The user will need to manually change population and migration data for subnational analyses. |
| AIM | Uses HIV prevalence and other epidemiological parameters to project the consequences of the HIV epidemic, including the number of people living with HIV, new infections, and AIDS deaths by age and sex. Calculates the impact of PMTCT, ART and Cotrimoxozole on child deaths for the LiST module and the impacts of ART on adult mortality. | AIM Manual (jhsph.edu) | There are very few countries that are missing AIM data, though the analyst can enter data for the AIM module. If there is no data, OneHealth will still function, but should not be used for the costing and impact of HIV/AIDS activities. |
| FamPlan | Projects family planning requirements needed to reach national goals for addressing unmet need or achieving desired fertility. Uses assumptions about the proximate determinants of fertility and the characteristics of the family planning program (method mix, source mix, discontinuation rates, etc.) to calculate the number of users and acceptors of different methods by service delivery source. | FamPlan Manual (futuresinstitute.org) | |
| LiST | Projects the mortality impact of scaling up maternal and child health interventions. | LiST Manual (jhsph.edu) | |
| TB | Projects the impact of scaling up prevention and treatment interventions on tuberculosis (TB) mortality and morbidity. | Global Tuberculosis Programme (who.int) | For several countries, default data do not exist for the TB module. For these countries, the user should turn off the TB module. |
| Goals | Converts coverage of key HIV/AIDS interventions into reductions in HIV prevalence. | Goals Manual29 | |
| NCD | Projects the impact of disease-specific and health-system interventions on a series of non-communicable disease outcomes. | NCD user guide for the OneHealth Tool.pdf (avenirhealth.org) | |
| Malaria | Projects the cost and health impact of malaria intervention packages. | Malaria Model Methods Report30 |
Appendix C: Data within AirQ+ and BenMAP-CE
AirQ+ is an open source excel based software tool designed to calculate the health effect of exposure to certain air pollution in given population. The tool quantifies the health effect of short- and long-term exposure to ambient air pollution (PM2.5, PM10, NO2, O3, Black Carbon) and long-term exposure to household pollution (Solid fuel). Various health outcomes related to mortality and morbidity, both in terms of acute and chronic conditions can be considered in the calculations. AirQ+ can be used for any country, city, or region to estimate the health outcome associated to the selected air pollutant.
BenMAP-CE is an additional user friendly and open-source software tool initially developed by EPA to support the U.S. air quality policy analysis. Much like AirQ+, BenMAP-CE estimates the health effect of exposure to air pollution however it has an additional feature that allows users estimates the economic value associated with change in air quality.
Table C.1 provides an overview of preloaded data and detailed description of user provided external data in each of the two software programs, AirQ+ and BenMAP-CE . Depending on the nature and complexity of analysis users can choose to provide data from their preferred sources. BenMap-CE has wide range of preloaded data that beginner to intermediate users could use, yet it provides options to use complex external data. Whereas AirQ+ is limited and mostly rely on users provided data.
| BenMAP – CE | AirQ+ | |||
|---|---|---|---|---|
| Preloaded Data | User Provided Data | Preloaded Data | User Provided Data | |
| Pollutants |
|
User could conduct analyses for other pollutants if data provided as noted within this table |
|
User could conduct analyses for other pollutants if data provided as noted within this table |
| Air Quality | Year 2000–2013 PM2.5 and ozone monitoring data for the contiguous U.S. | Import .csv or .xlsx file specifying air quality modeling or monitoring data | n.a.2 | Import .csv file with air quality data for geographic area(s) of interest |
| Population | U.S. population projections from 2000 to 2050 in 1-year increments stratified by sex/age/race/ethnicity at 12 km grid cells | Import .csv or .xlsx file specifying sex/age/race/ethnicity for a defined population assigned by grid cell | n.a. | Import .csv file with population data for geographic area(s) of interest |
| Baseline Rate of Deaths and Illnesses |
|
Import .csv or .xlsx file specifying age/race/ethnicity stratified incidence rate assigned by grid cell for a defined geographic location | n.a. | Import .csv file with baseline rate of deaths for geographic area(s) of interest |
| ß Coefficient | Over 100 PM2.5 and ozone health impact functions drawn from U.S. and Canadian studies. Endpoints include mortality, hospital admissions, emergency department visits, exacerbated asthma, acute respiratory symptoms, school/work loss days | Import .csv or .xlsx file specifying health impact function(s), including health endpoint, functional form, ß coefficient, applicable age/sex/race/ethnicity information | Over 50 health impact functions spanning PM2.5, PM10, NO2, ozone, BC and solid fuel use drawn from European studies. Endpoints include all-cause and cause-specific mortality, post neonatal infant mortality, prevalence of bronchitis in children, incidence of chronic bronchitis in adults, incidence of asthma symptoms in asthmatic children, hospital admissions: CVD and respiratory diseases, Restricted activity days (RADs) | User can modify coefficients |
| Health Impact Function (HIF) Functional Form |
|
User can select various operators, variables, and population variables to define unique functions, including specifying different functions for different parts of an air quality distribution |
|
n.a. |
| Distributions that can be Specified for Uncertainty Calculations |
|
Users can select a non-parametric custom distribution | n.a. | n.a. |
| Economic Values | Multiple cost-of-illness (COI) and willingness-to-pay (WTP) studies for each health endpoint quantified by health impact function | Import .csv or .xlsx file specifying COI or WTP function(s), including health endpoint and unit value | n.a. | n.a. |
| Additional Features | Global Burden of Disease (GBD) Rollback tool allows estimation of PM2.5 health impacts worldwide based on data from GBD study. | n.a. | Cancer Unit Risk Values for arsenic, benzene, benzo[a]pyrene, chromium (VI), nickel and vinyl chloride | User can modify coefficients |
Source: Environment Protection Agency, Quantifying the Public Health Benefits of Reducing Air Pollution: Critically Assessing the Features and Capabilities of WHO’s AirQ+ and U.S. EPA’s Environmental Benefits Mapping and Analysis Program – Community Edition (BenMAP – CE), 2021.
| Health outcome | Exposure | ||||||||||
|---|---|---|---|---|---|---|---|---|---|---|---|
| Ambient air pollution | Household air pollution | ||||||||||
| Long-term | Short-term | Long-term | |||||||||
| PM2.5 | PM10 | NO2 | O3 | BC | PM2.5 | PM10 | NO2 | O3 | Solid fuel use | ||
| Mortality | Mortality, all (natural) causes | x | x | x | x | x | x | ||||
| Mortality, ALRI (children 0-4) | x | x | |||||||||
| Mortality, COPD (adults 30+) | x | ||||||||||
| Mortality, COPD (women 30+) | x | ||||||||||
| Mortality, COPD (men 30+) | x | ||||||||||
| Mortality, IHD (adults 30+) | x | ||||||||||
| Mortality, IHD (women 30+) | x | ||||||||||
| Mortality, IHD (men 30+) | x | ||||||||||
| Mortality, LC (adults 30+) | x | ||||||||||
| Mortality, LC (women 30+) | x | ||||||||||
| Mortality, LC (men 30+) | x | ||||||||||
| Mortality, Stroke (adults 30+) | x | ||||||||||
| Mortality, Stroke (women 30+) | x | ||||||||||
| Mortality, Stroke (men 30+) | x | ||||||||||
| Mortality, respiratory diseases | x | x | |||||||||
| Mortality, CVDs | x | ||||||||||
| Postneonatal infant mortality, all-cause | x | ||||||||||
| Prevalence/incidence | Prevalence of bronchitis in children | x | |||||||||
| Prevalence of bronchitis symptoms in asthmatic children aged 5-14 | x | ||||||||||
| Incidence of chronic bronchitis in adults | x | ||||||||||
| Incidence of asthma symptoms in asthmatic children | x | ||||||||||
| Hospital admissions | Hospital admissions: CVD (including stroke) | x | |||||||||
| Hospital admissions, CVD (without stroke) | x | ||||||||||
| Hospital admissions: respiratory diseases | x | x | x | ||||||||
| RADs/work days lost | Work days lost, working age population only | x | |||||||||
| Restricted activity days (RADs) | x | ||||||||||
| Minor restricted activity days (MRADs) | x | ||||||||||
Acronyms: Acute lower respiratory disease (ALRI), chronic obstructive pulmonary (COPD), Ischaemic heart disease (IHD), lung cancer (LC), cardiovascular diseases (CVD), restricted activity days (RADs), minor restricted activity days (MRADs), particulate matter less than 2.5 microns (PM2.5), particulate matter less than 10 microns (PM10), nitrogen dioxide (NO2), ozone (O3), black carbon (BC)
Source: AirQ+: key features (who.int)
2023-001-2859-01