Program Overview
MCC’s $506.9 million Mozambique Compact (2008-2013) funded the $200.2 million Water Supply and Sanitation Project which included the $12.9 million Rural Water Supply Activity to increase access to safer water and improved sanitation in rural communities. This activity was based on the theory that constructing 615 boreholes with hand pumps, mobilizing water committees to maintain the infrastructure, and training 8,400 individuals on hygiene and sanitation practices would decrease waterborne illnesses and reduce the time spent collecting water and caring for the sick, leading to more time spent on productive activities.
Key Findings
Safer Water Access and Use
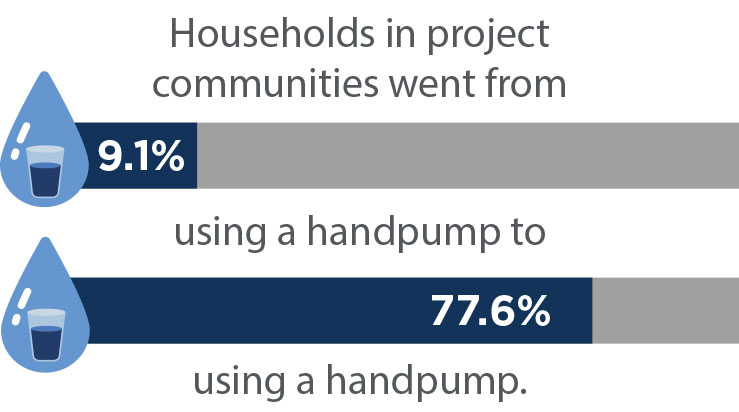
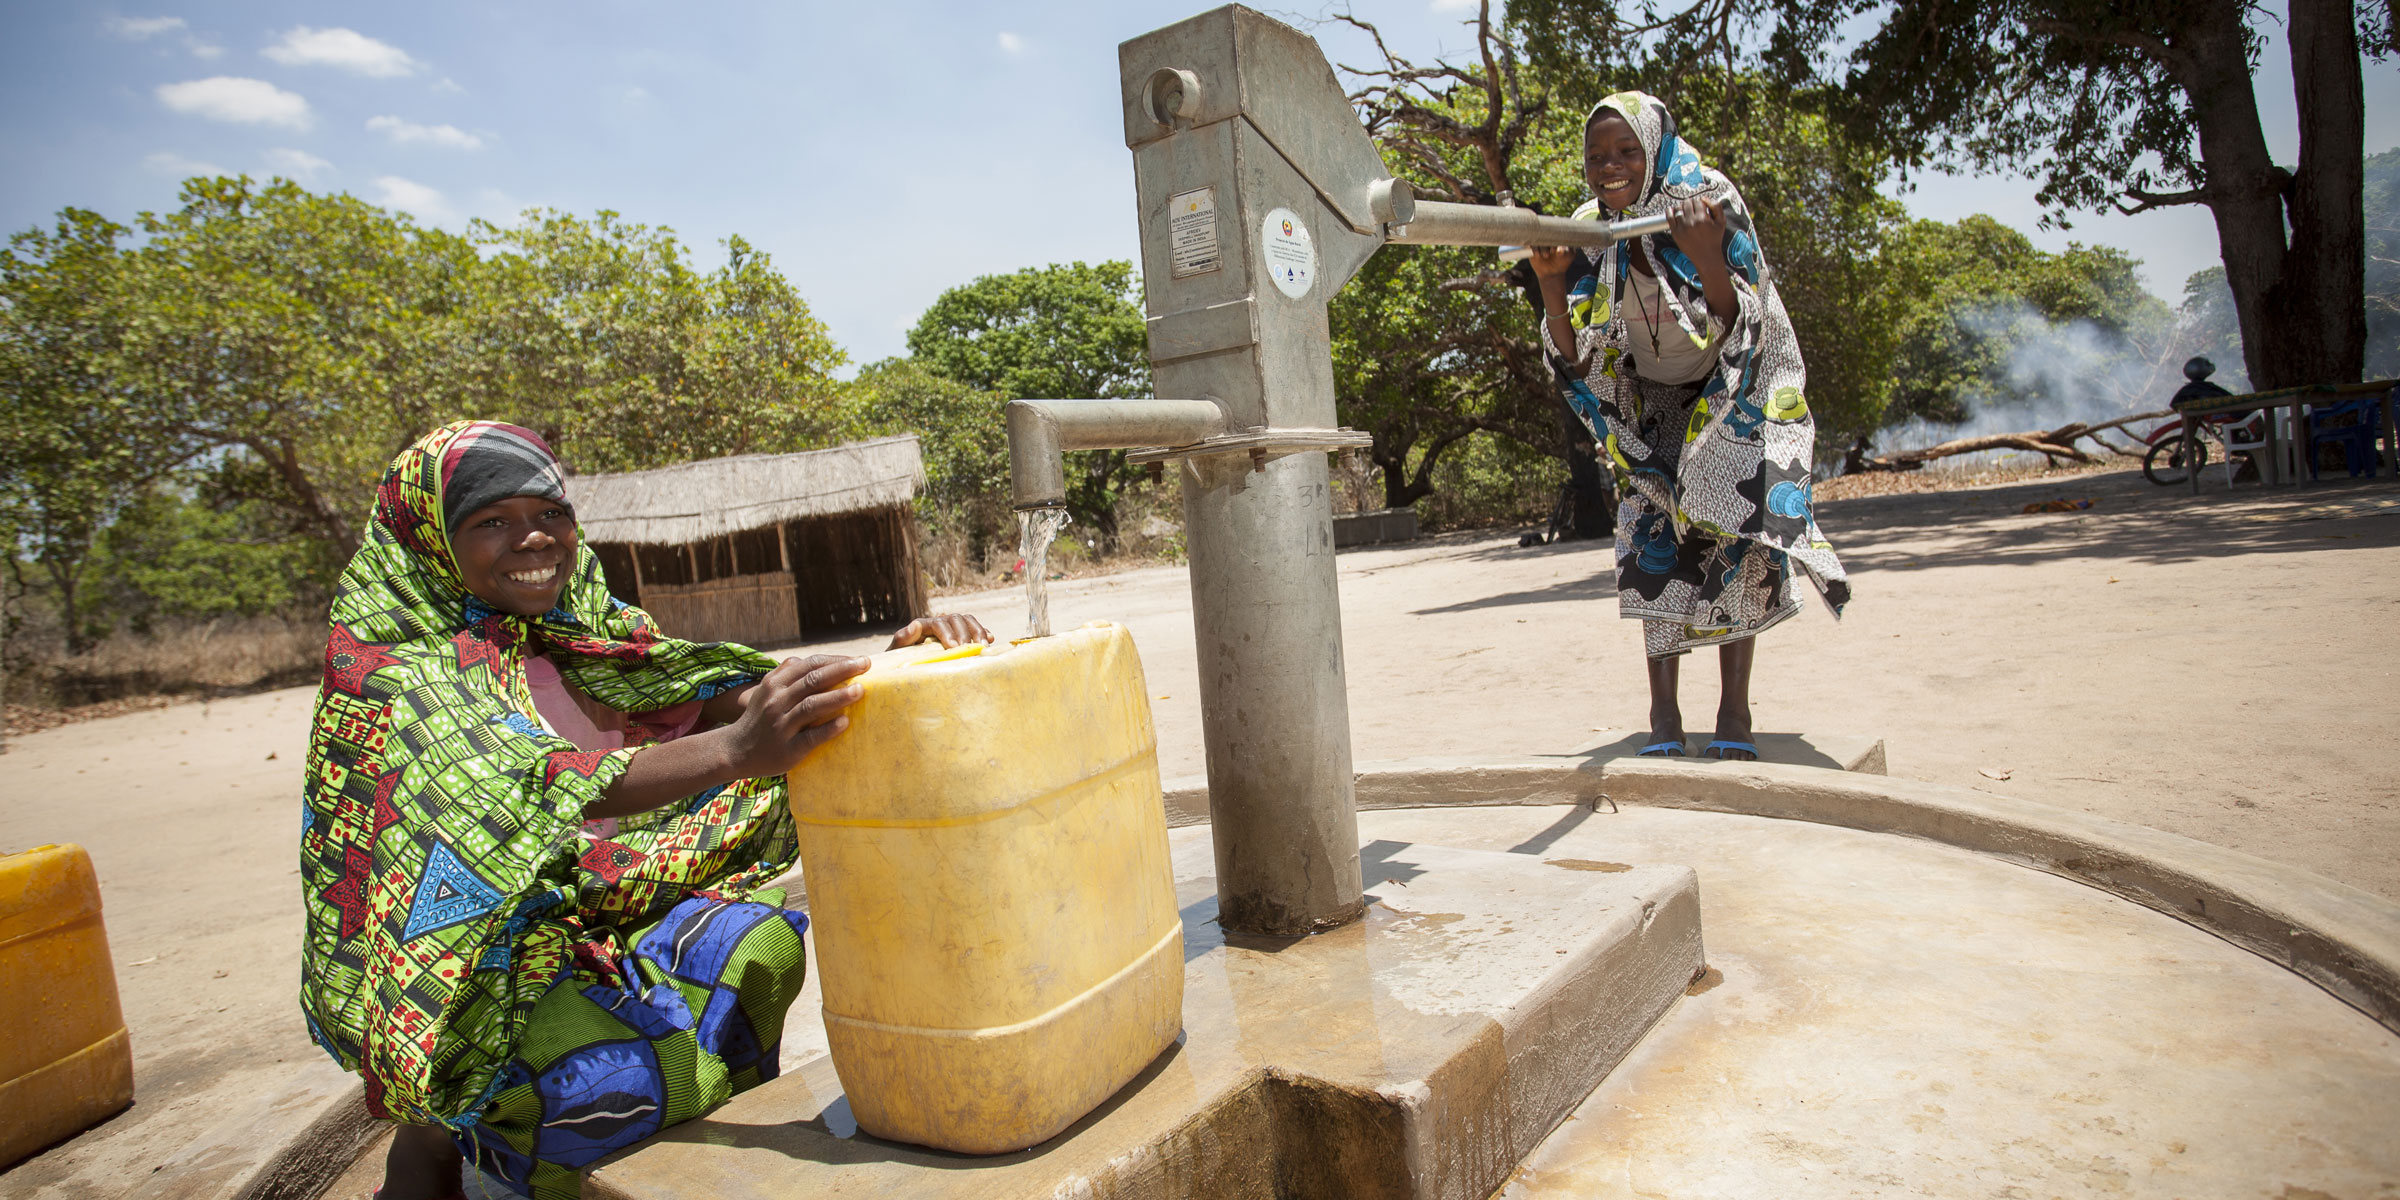
- Households in project communities switched from majority unsafe water sources - 85.4 percent unprotected wells - to majority safe - 77.6 percent - as a result of the installed hand pumps.
- Water quality testing showed higher quality water at the hand pumps.
- Median household water consumption from safer sources (handpumps, protected wells and springs, and public taps) in project communities increased 16.7 liters per capita per day compared to households in communities that did not receive the intervention, however with no impacts on total water consumption.
Time Savings and Productivity
- Water collectors (mostly women and youth) reported time savings of 55 minutes per each 20 liters of water collected.
- Time savings was used for domestic chores, rest, spending time with family, and working in the field.
Hygiene and Sanitation Behaviors and Health Outcomes
- Community-based training failed to impact sanitation and handwashing behavior.
- The activity failed to reduce the percentage of reported waterborne illness in children under five.
- Continued use of unsafe water sources, household water storage methods, and inadequate hygiene and water management practices prevented predicted health improvements.
Household Income and Sustainability
- The project had no impact on median household income in project communities.
- While water committees were still functioning at a high level, they raised sustainability concerns, including lack of sufficient revenues, access to parts, and technical capacity for repairs.
Evaluation Questions
This final impact evaluation was designed to answer whether or not installing boreholes with hand pumps and conducting hygiene and sanitation training:
- 1
Improved household access to safer water sources? - 2
Increased the volume of water consumed by household members? - 3
Reduced the time household members spent collecting water? - 4
Increased productivity as a result of time savings? - 5
Improved sanitation behaviors? - 6
Reduced the percentage of children under the age of 5 with reported respiratory and gastrointestinal illness? - 7
Increased levels of household monthly income or expenditure?
Detailed Findings
Safer Water Access and Use


The installed hand pumps provided treatment communities with safer water: water quality testing at the hand pump showed contamination at low risk levels, while 39 percent of traditional wells and 71 percent of surface sources showed high levels of contamination. Households in project communities substituted unsafe for safe water with median water consumption per capita from safe sources increasing 16.7 liters per day when compared to comparison communities. Despite the improved access to safer water, households living in project communities continued to use unsafe sources: 20.6 percent used water from unprotected wells and 8.7 percent from rivers/lakes. For those households that did not use the handpump, the most frequently cited reason was distance, followed by the cost of water. Once households were more than 1.2 km from the handpump, the likelihood of them using the handpump decreased below 50 percent. Additionally, for every 100 m increase in the distance from a household to its nearest handpump, the volume of improved water collected dropped by 1 LPCD.
Time Savings and Productivity


Women and youth were primarily responsible for water collection in these communities. In the project communities, these water collectors collected 3.6-10 liters more water on average from all sources—safe and unsafe—with the largest increase experienced by female youth. Time savings was largely driven by a statistically significant reduction of 41 minutes in waiting time at the water source. Of the water collectors living in treatment areas who reported time savings from collecting water, 11.7 percent reported they allocated time savings to domestic chores, 10.4 percent to rest, 9.8 percent to spend time with family, and 7.1 percent to work in the field. In addition, 17.5 percent fewer households reported water collection negatively affected child’s school attendance. While the time savings used for rest and leisure activities is not typically associated with economic value, the fact that community members choose to use the time savings in this way demonstrates that they value this time.
Hygiene and Sanitation Behaviors and Health Outcomes

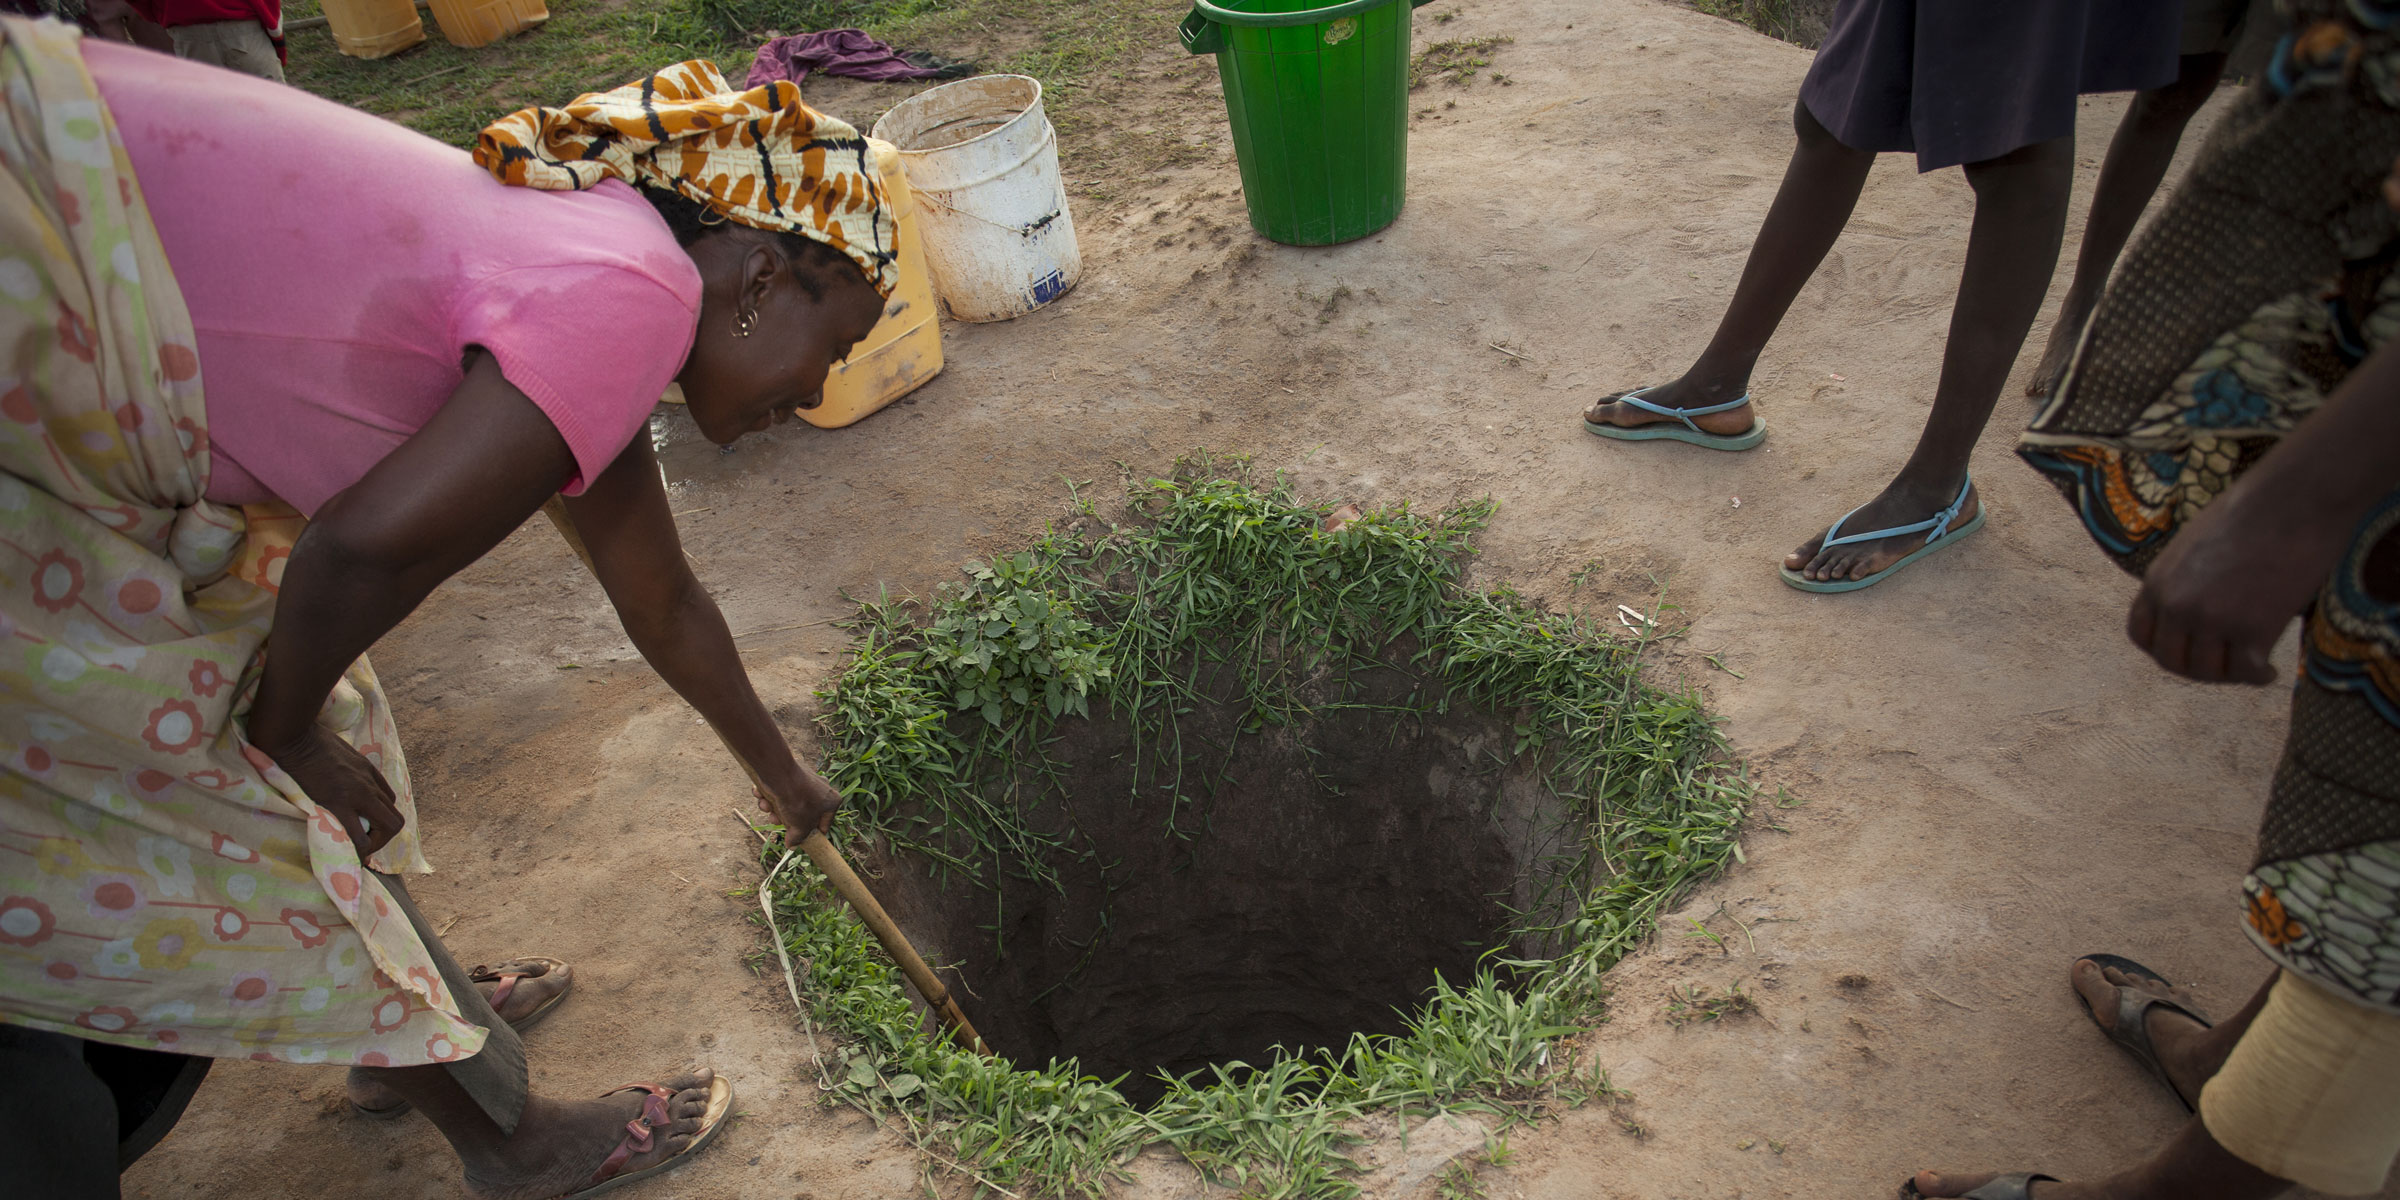
Residents draw water from hand-dug wells in the Muala Expansion neighborhood of Nampula, Mozambique.
Improper handling and/or storage of water at the household likely reintroduced contamination. Almost half of the samples taken from water stored at the households, but collected from handpumps, tested as high risk contamination levels that were unsafe for consumption. In addition, the community-based trainings had no impacts on sanitation practices and handwashing. Given these behaviors, waterborne illnesses did not decrease as predicted in the theory of change.
Household Income and Sustainability
There was no evidence that the project increased household incomes, though there was an overall trend of economic growth in the region. Water committees were still functioning at a high level. Revenues generated from water sales appeared to support the regular operation and maintenance of the hand pumps. In addition, only 6 percent of water committees believed their hand pump would be functioning in 10 years. Key sustainability issues identified by the water committees were a lack of sufficient revenues, access to spare parts, and technical capacity for larger repairs.
MCC Learning
Critically assess site selection by considering the distance household members are willing and able to travel for safe water to maximize time savings and consumption targets.
Understand social norms as they relate to time use when proposing impacts on productivity.
Consider the economic value of leisure activities and domestic work when estimating project impacts on economic productivity.
Understand household water storage practices and water use practices when hypothesizing impacts on health outcomes that are dependent on hygiene and sanitation behaviors.
Evaluation Methods

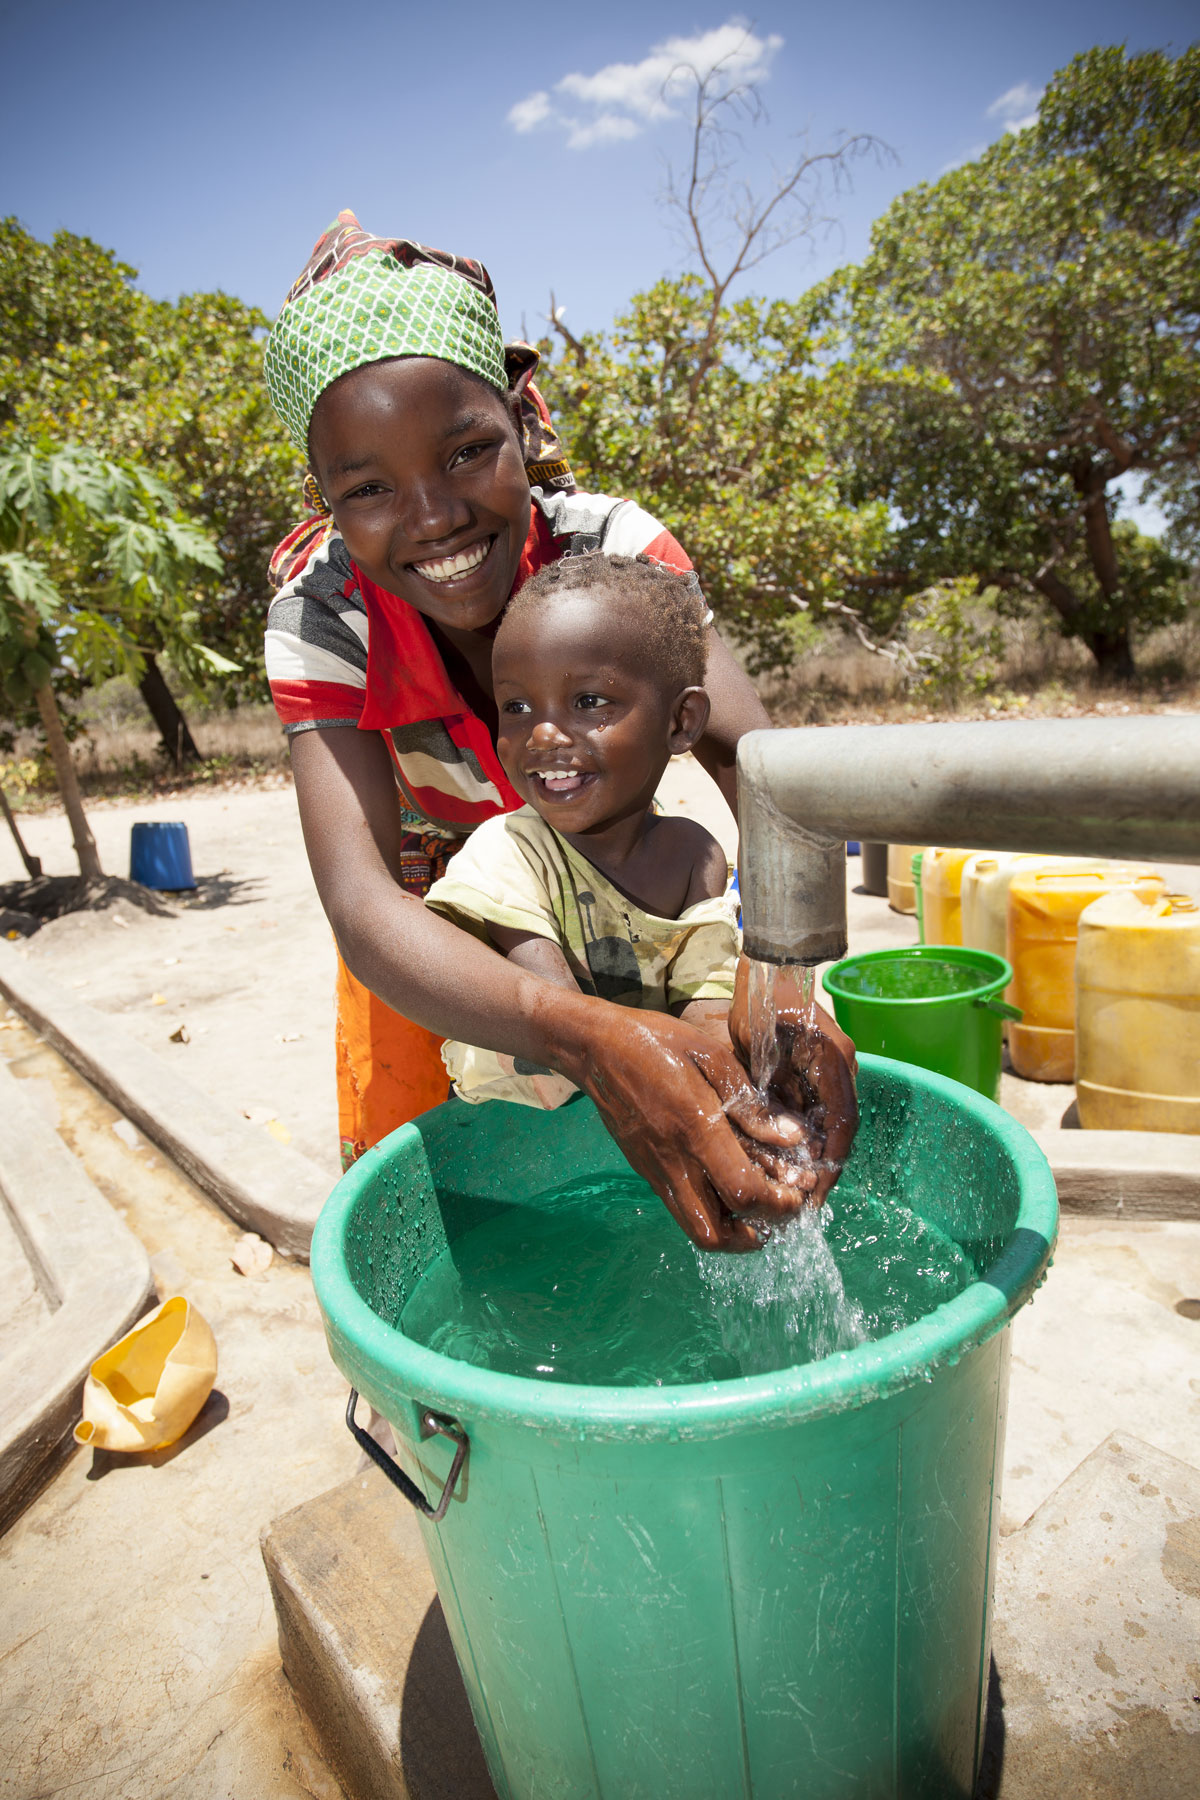
Mercia Rapido and her daughter Eliza Adolfo draw clean water from a borehole in Mecupes village, Mozambique.
The final impact evaluation uses a difference-in-differences methodology to estimate impacts of the Rural Water Supply Activity. Treatment areas were selected through a community-driven approach at the district level in Nampula and Cabo Delgado. Comparison communities were randomly selected from the same four districts (Mogincual, Murrupula, Mogovolas, and Moma) as the sampled treatment communities.
The project was implemented in three phases across Nampula and Cabo Delgado provinces. The evaluation focused on the Nampula province where 100 boreholes were installed in Phase 1, 150 in Phase 2, and 108 in Phase 3. Given timing of implementation and evaluation surveys, the impact evaluation sample focused on the Phase 2 communities, sampling 15 treatment and 23 comparison communities with an exposure period of 17-24 months. Evaluation questions related to sustainability focused on Phase 1 and Phase 2 communities with an exposure period of 17-31 months.
The impact evaluation relied on panel data set consisting of a 2011 baseline survey and a 2013 follow-up survey. The specific surveys and sample sizes were:
- Households surveys sampled 1,579 households in 54 communities (27 treatment and 27 comparison) in 2011, and 1,826 households in 62 communities (32 treatment and 30 comparison) in 2013;
- Key informant interviews with 54 water committee interviews in 2011 and 31 in 2013;
- Water quality samples tested in 11 communities from 39 community water sources and 259 household containers in 2011 and 11 communities from 32 community water sources and 873 household containers in 2013;
- Water point direct observations were undertaken in 17 communities in 2013 only.


