Program Overview
MCC’s $177.7 million Armenia Compact (2006–2011) funded the $153.7 million Irrigated Agriculture Project, which included the $32.2 million Water-to-Market Activity (WtM) to increase the agriculture sector’s productivity by complementing the irrigation infrastructure investment. The activity was designed on the theory that training in agricultural practices, increased access to credit for investment, improved capacity of the water user associations (WUAs) to manage water resources, and technical assistance to improve marketing opportunities would prepare and encourage farmers to shift production to higher-value agriculture (HVA), thereby increasing profits and income.
Key Findings
Activity Implementation
- Many farmers received training who did not have timely or sufficient access to irrigation water. Many trainees were dissatisfied when their expectation of receiving credit was unfulfilled because of the small number of loans available.
- Staff from the 44 WUAs had mixed reactions to support provided by the compact.
- It was difficult to identify enough registered enterprises for post-harvest, processing, and marketing assistance.
Use of New Practices
- Overall, training did not affect agricultural practices relative to the control group. WtM credit recipients had more resources and agricultural investments than other farmers did.
- WUAs improved their financial standing and increased membership during implementation.
- Recipients of post-harvest, processing, and marketing assistance had mixed impressions of its usefulness.
Production, Income, and Poverty
- Training did not increase the land irrigated, the crop types cultivated, total production, or sales.
- WtM credit may have influenced crop production and household income.
- More than 70 percent of enterprises reporting improved quality, sales, profits, and productivity also reported that post-harvest, processing, and marketing assistance contributed to these improvements.
Evaluation Questions
This final impact and performance evaluation was designed to answer the following questions:
- 1
How was the activity implemented? - 2
What were the impacts of the activity’s components? What were the impacts on practices or use of new technologies as a result of each component? What were the impacts on key outcomes such as household income and poverty?
Detailed Findings
Activity Implementation

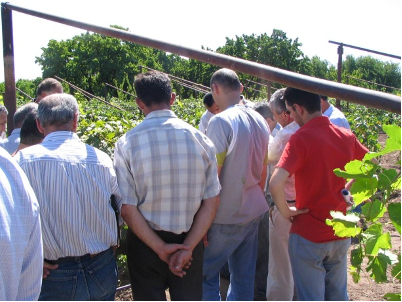
Armenian farmers learning in the field
Though the training was targeted for communities expected to have adequate irrigation, by the end of the training the irrigation in many targeted communities was still inadequate. This was due to both delays in irrigation improvements and faulty assessments of the existing availability of irrigation.
On-farm water management and high-value agriculture trainings surpassed their targets of 45,000 and 36,000 farmers trained, respectively. But the credit component of this activity was limited to loans for only about 1,100 of those trained, leaving many trainees disappointed when they could not secure a loan.
Staff from the 44 WUAs supported by the project generally did not consider the technical assistance provided by the project particularly helpful or relevant to their daily operations. In contrast, equipment support—including furniture, computers, and GIS software—was considered very useful.
Fewer than 200 registered small businesses operating in food production, processing, or marketing were eligible to receive post-harvest, processing, and marketing assistance, though the project had targeted 300 enterprises.
Use of New Practices
Overall, training in improved techniques did not affect agricultural practices relative to non-trained control farmers. Costs of these techniques and unreliable irrigation may have deterred adoption.
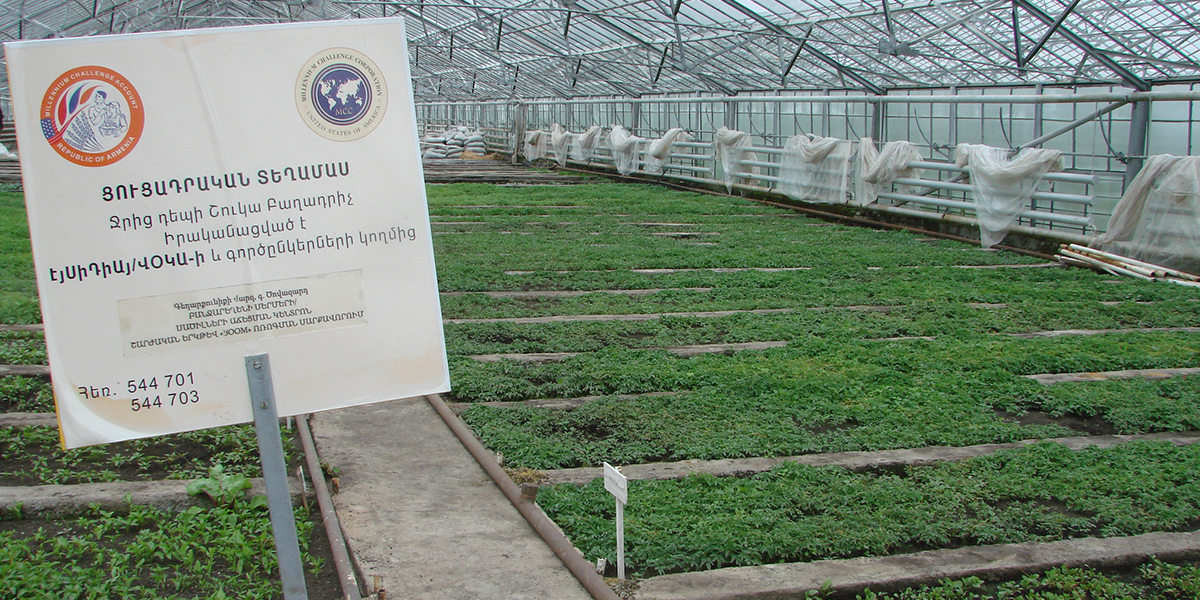
WtM credit recipients had more resources and agricultural investments tthan other farmers did. WtM credit recipients were much more likely than others to report establishing or renewing a greenhouse.
WUAs improved their financial standing and increased membership during implementation. WUA cost recovery improved from 37 percent in 2008 to 48 percent in 2010. From 2009 to 2010, WUA membership rose from 38 to 48 percent, and membership fee payment among WUA members rose from 75 to 92 percent. Despite these moderate improvements, WUAs do not yet appear to be approaching financial self-sufficiency in the short or medium term.
Recipients of post-harvest, processing, and marketing assistance reported mixed impressions of its usefulness. Fruit processors particularly valued training or assistance on dried fruit production and food safety. However, participation in local expositions and agricultural events did not directly help beneficiaries expand their access to markets and relationships with local and foreign partners. The establishment of collection and consolidation centers was viewed favorably by many stakeholders, but some centers performed better than others.
Production, Income, and Poverty

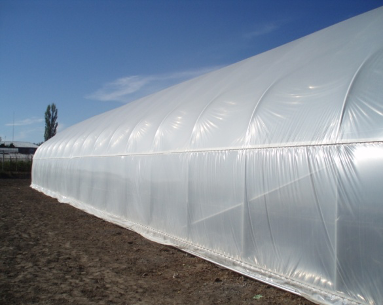
New greenhouse built by a demonstration farmer
The training did not increase the area of land irrigated, the types of crops being cultivated, total production, or sales, nor did it affect poverty rates compared with the control group.
WtM credit may have affected crop production and household income. WtM recipients produced 6 tons more high-value crops and more than $2,000 (or 50 percent) greater harvest value than others, after accounting for baseline differences. However, these findings may also be partly explained by more general entrepreneurial behavior among the recipients.
There was conflicting evidence about whether the post-harvest, processing, and marketing assistance had a positive effect on enterprises’ outcomes. More than 70 percent of enterprises that reported improved quality, sales, profits, and productivity stated that post-harvest, processing, and marketing assistance contributed to these positive outcomes. Although the survey conducted for the evaluation showed highly positive outcomes, these findings are at odds with a qualitative process analysis conducted during implementation that suggested that the assistance generally did not lead to measured improvements in production or sales.
MCC Learning
Always return to the program logic. It is especially important in integrated projects to ensure that participants overlap and timing is coordinated between complementary activities.
Balance ambitious implementation targets with training effectiveness. High training targets made it difficult to concentrate resources on farmers who were most likely to benefit from trainings.
The randomized rollout evaluation approach has risks. Timelines for farmer adoption of new practices, the five-year compact timeline, and inevitable implementation delays made the randomized rollout a risky approach.
Evaluation Methods

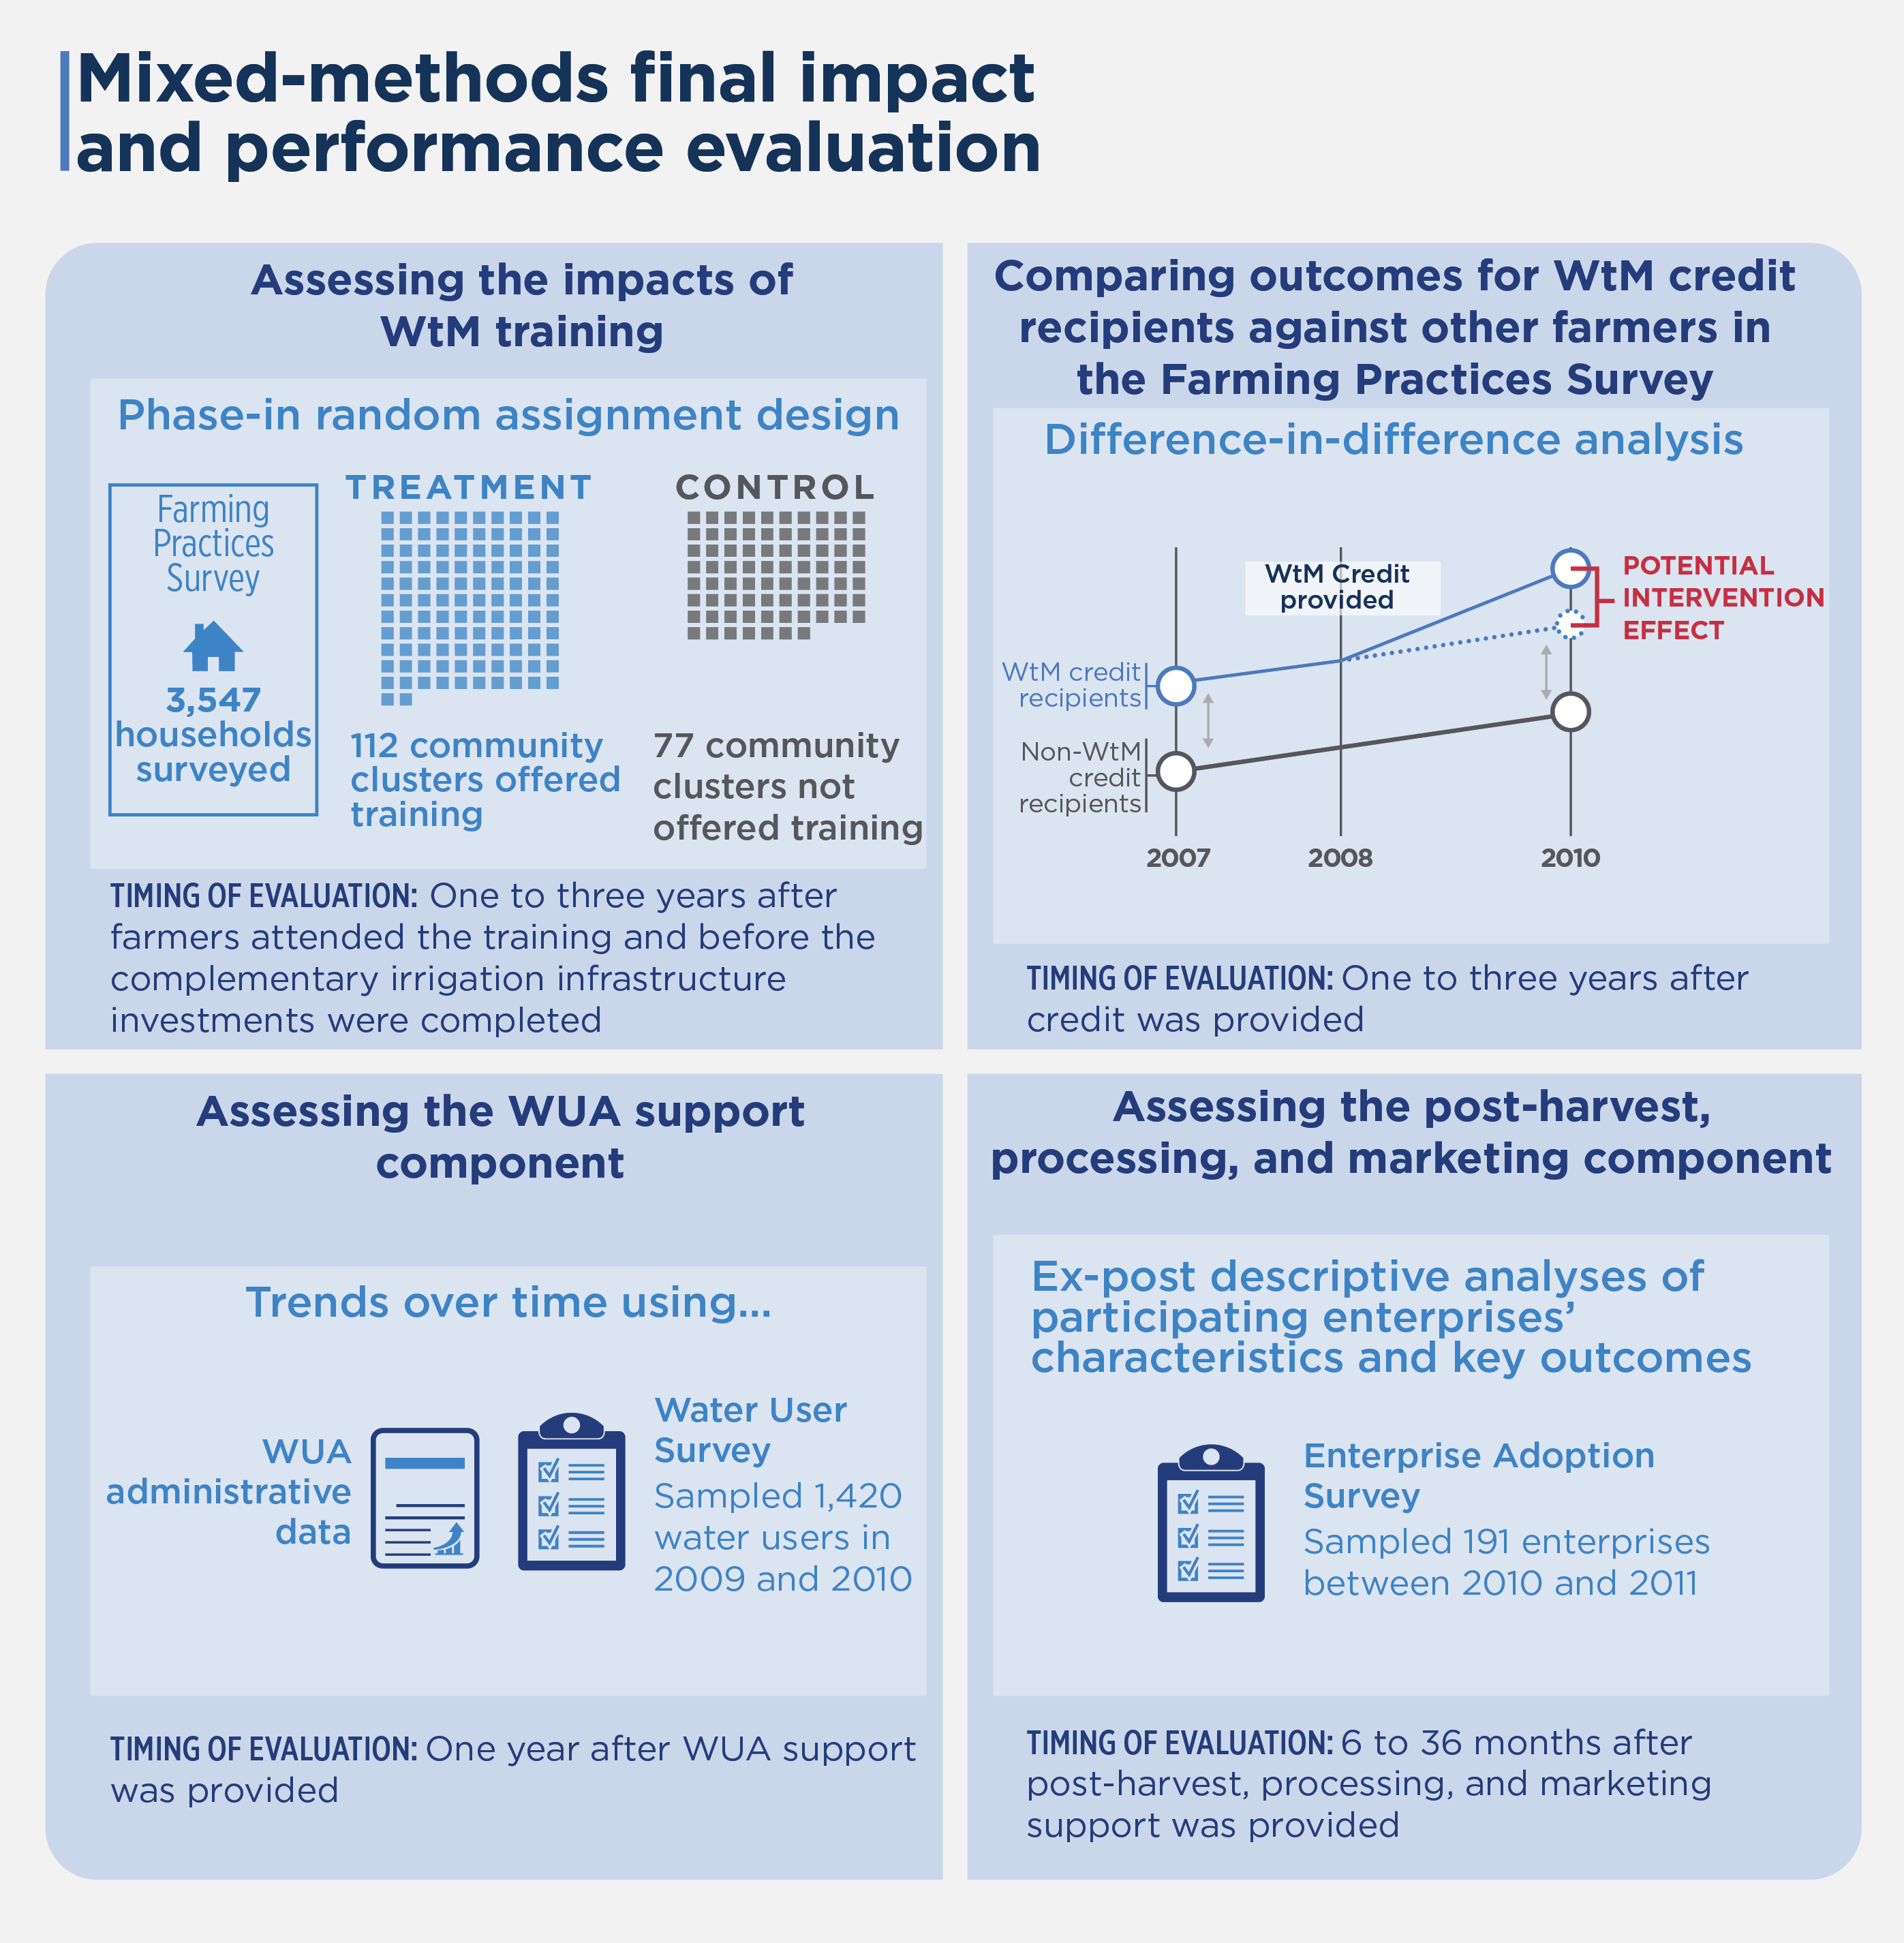
This mixed-methods final impact and performance evaluation included four methodologies to cover each of the activity components.
To assess the impacts of WtM training, the evaluation used a phase-in random assignment design, whereby 112 community clusters were randomly assigned into a treatment group and 77 into a control group that was not offered training during the evaluation period. The impact of training was assessed one to three years after farmers attended the training and before the complementary irrigation infrastructure investments were completed.
The evaluation of the WtM credit component used difference-in-difference to compare outcomes for WtM credit recipients with those from other farmers in the Farming Practices Survey, regardless of whether they received any credit from non-MCC sources. The evaluation was completed one to three years after credit was provided.
The WUA support component evaluation analyzed trends over time using WUA administrative data and a water user survey. The evaluation was completed about one year after WUA support was provided.
For the post-harvest, processing, and marketing component, the evaluation focused on ex-post descriptive analyses of participating enterprises’ characteristics and key outcomes using the enterprise adoption survey. The evaluation was completed 6 to 36 months after post-harvest, processing, and marketing support was provided.
The specific surveys and sample sizes were as follows:
- The farming practices survey sampled 3,547 households in treatment and comparison clusters in 2007, 2008, and 2010.
- The water user survey sampled 1,420 water users in 2009 and 2010.
- The enterprise adoption survey sampled 191 enterprises between 2010 and 2011.
2020-002-2469


